Last year was TikTok’s time to shine. But with the ever-changing social media scene, it’s hard to predict what 2023 will bring.
With the answer usually relying on the data, we started this brand new year armed with a magnifying glass and analyzed more than 190M social media posts to uncover future trends on social.
Reading this social media benchmark report, you’ll discover what’s the engagement rate for each social platform and get up-to-date social media industry benchmarks.
Let’s dive in!
A. Social media engagement benchmarks – key insights
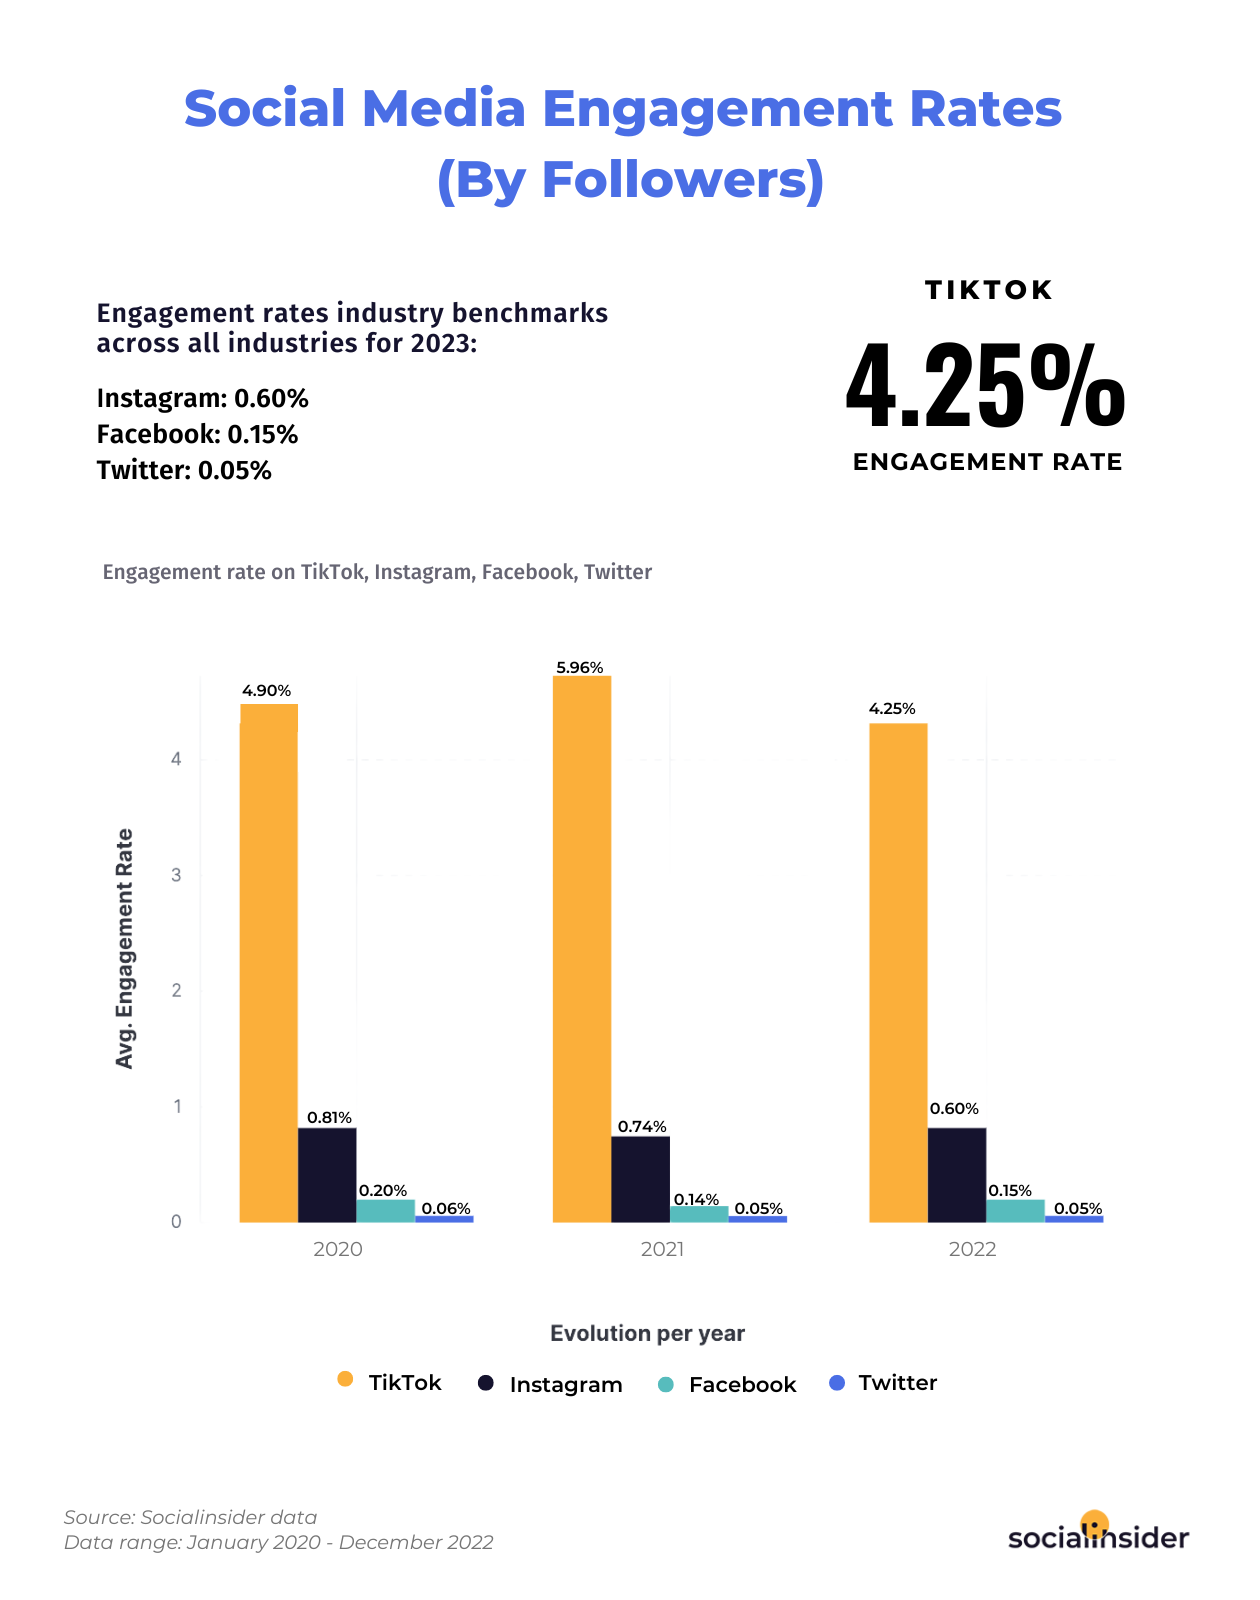
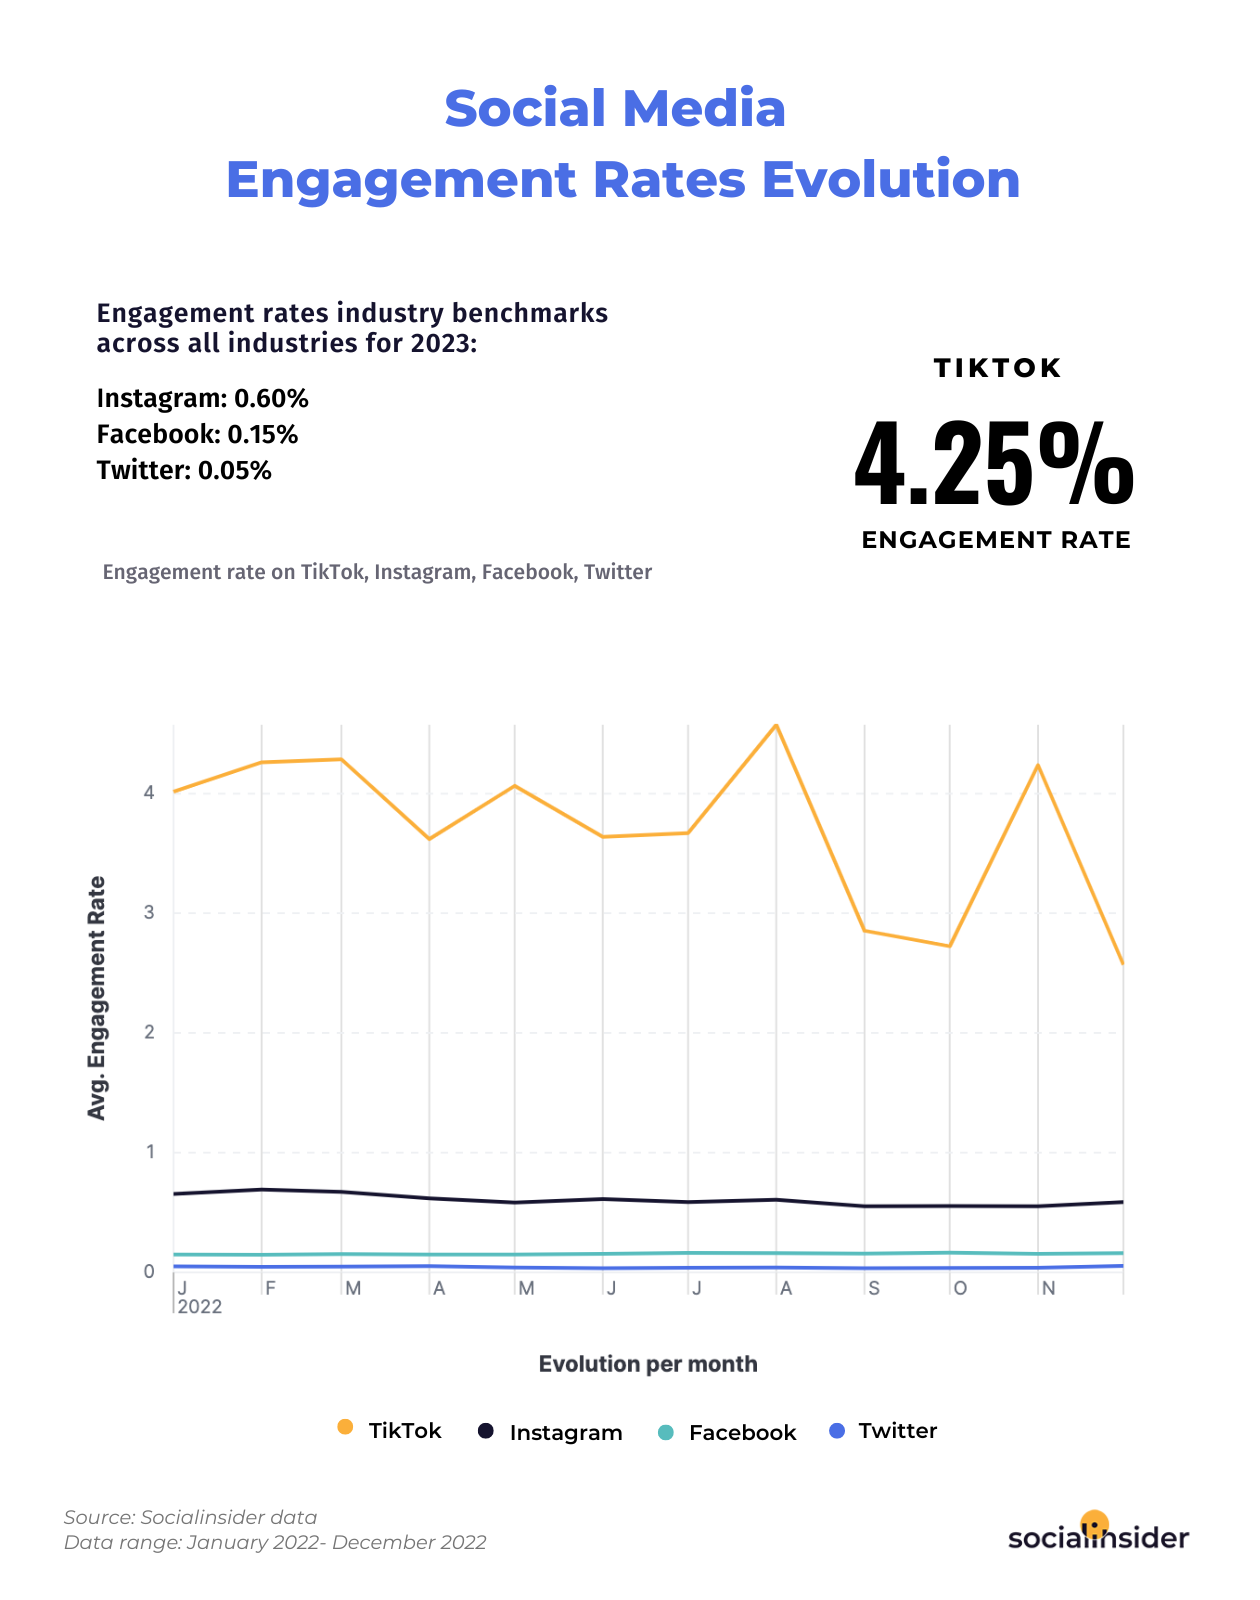
- TikTok’s average engagement rate – calculated by followers – is 4.25%, while the engagement rate by views is 5.10%.
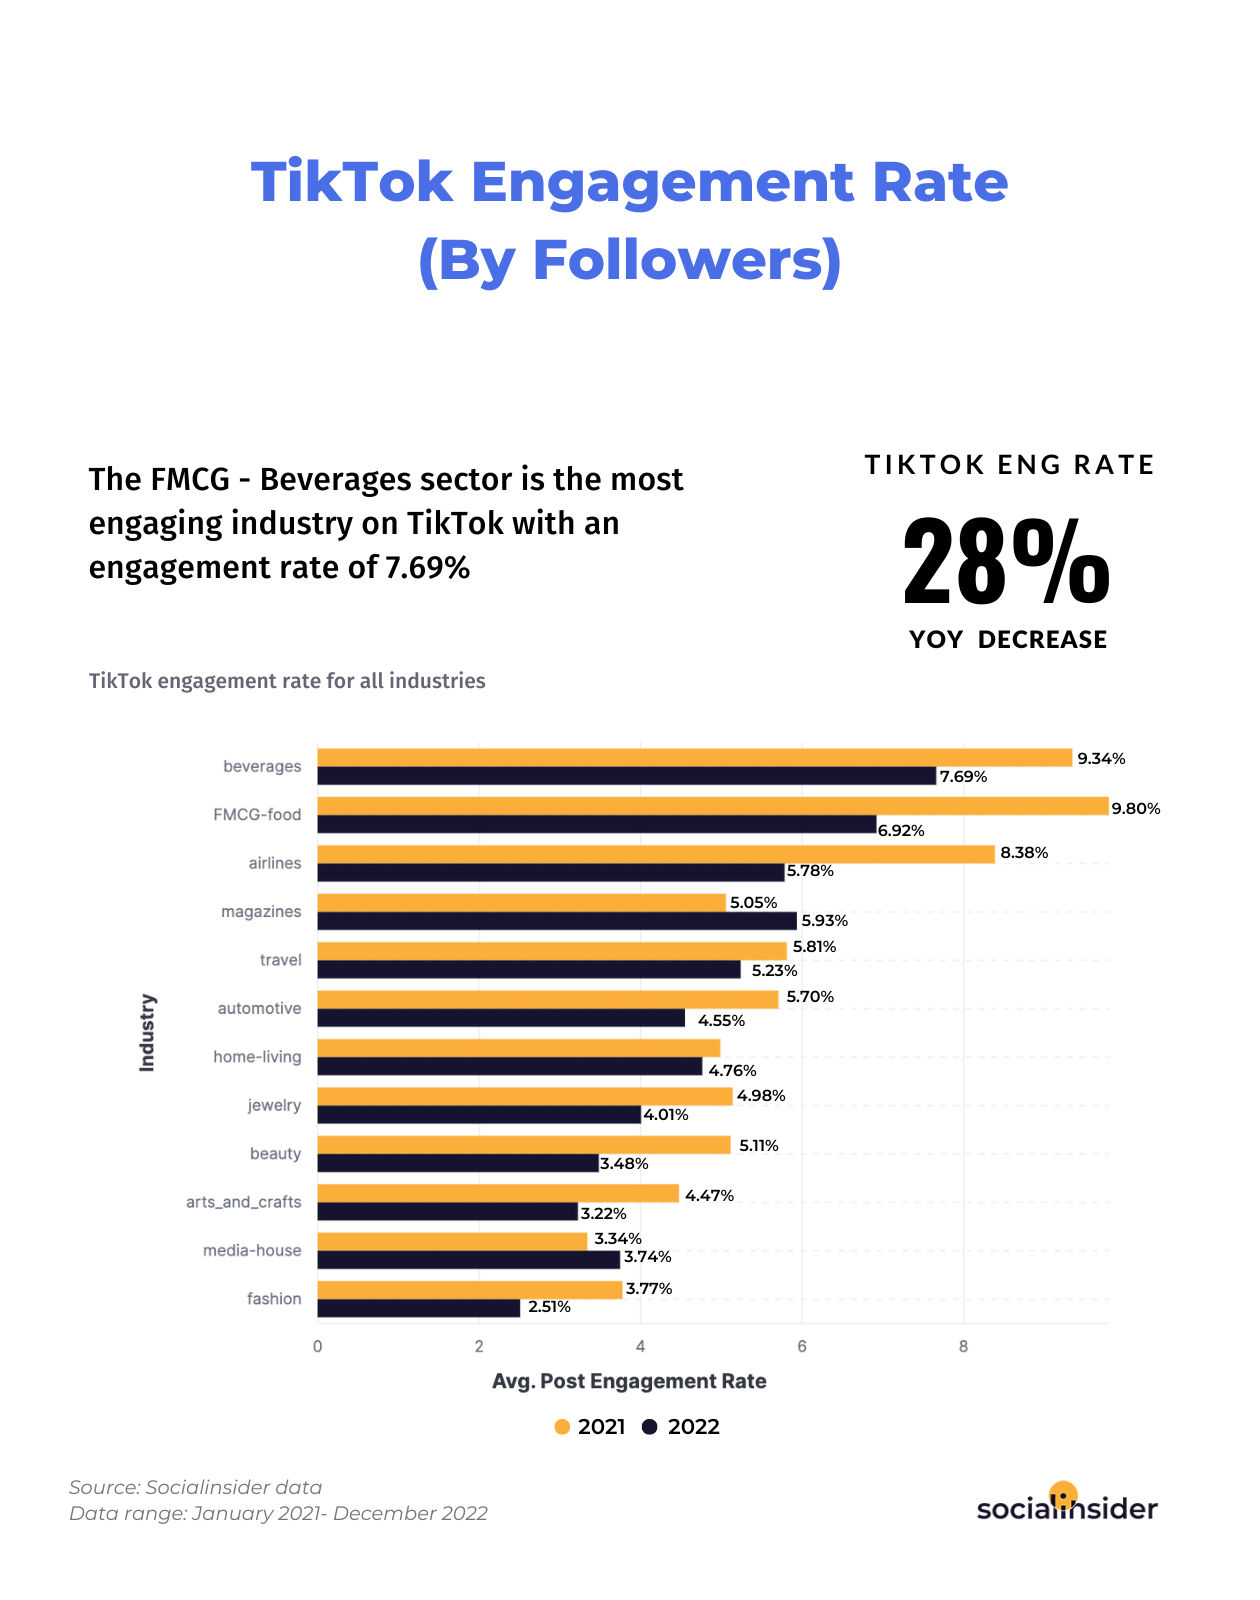
- The average engagement rate on TikTok is slowly but steadily decreasing year after year by about 28%.
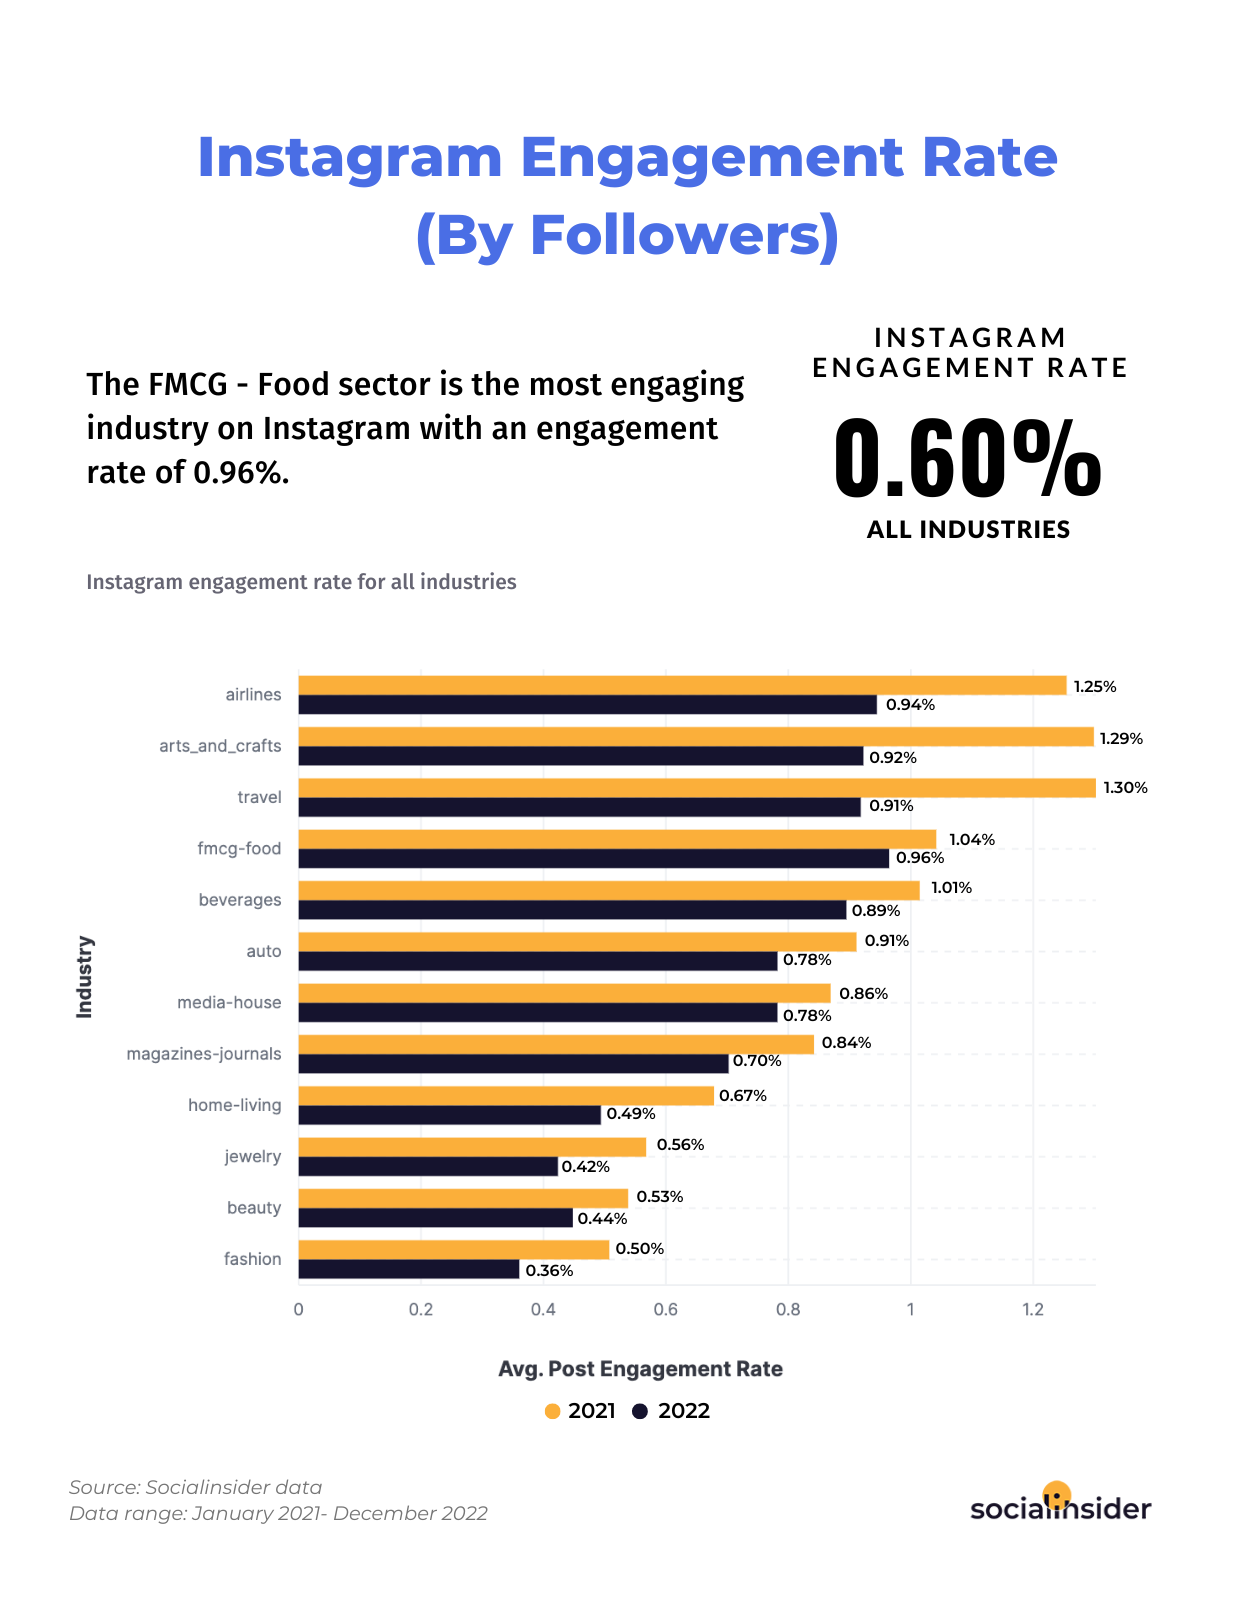
- Instagram records an average engagement rate of 0.60%, that’s continuously decreasing.
- Reels represent the best-performing content type on Instagram, generating double the engagement of the other post formats.
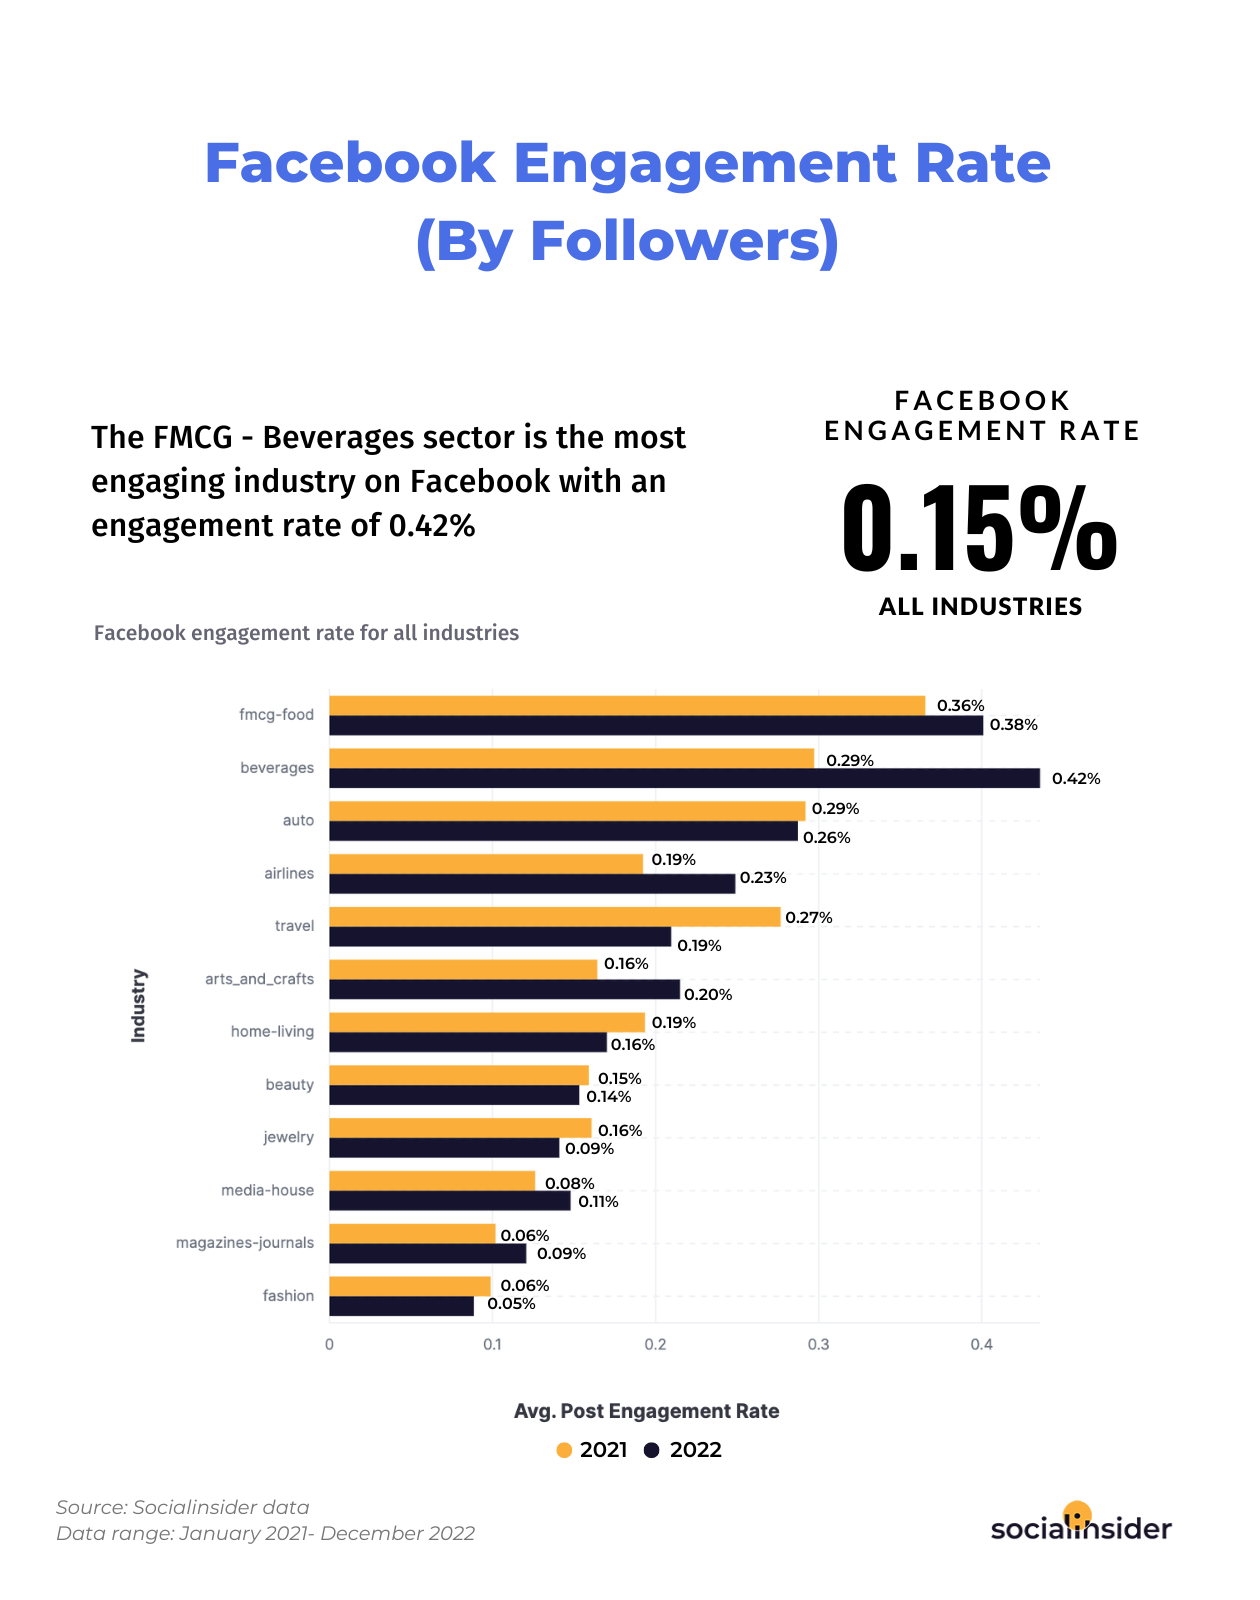
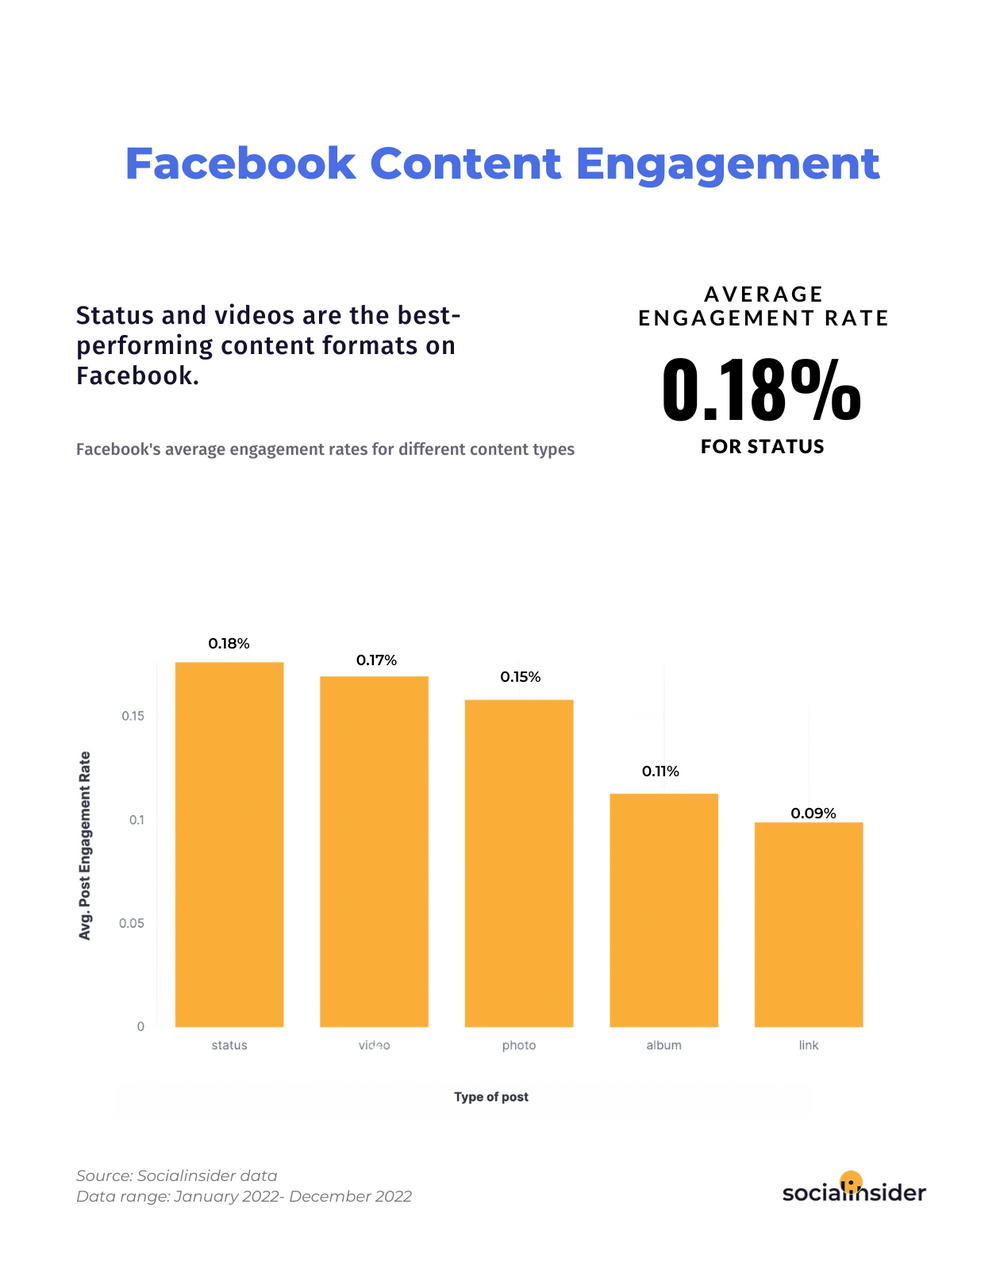
- Overall, Facebook’s engagement rate is located at an average of 0.15%.
- The most engaging business lines across all the social platforms are: the beverages industry on TikTok and Facebook, the food industry on Instagram, and the arts & crafts industry on Twitter.
B. Social media benchmarks by platforms
Depending on the vertical of their business, some brands have an easier time communicating with their audience than others.
Simply put, specific audiences can be more or less responsive and engaging on social depending on the business industry.
To understand every social platform’s potential benefits for your brand, you need to benchmark social media engagement rates across all the important channels, altogether with industry-specific data.
Given TikTok’s growing popularity, there’s no surprise that, when narrowed down to engagement benchmarks, TikTok has the numeric advantage to make brands get on board and start experimenting with content on the platform.
Having an average engagement rate of 4.24%, TikTok is the most engaging social media platform of the moment, followed by Instagram, which has faced a pretty impactful drop in its once-great engagement.
While at the moment, the Instagram engagement rate stands at an average of 0.60%, Facebook records an average engagement rate of 0.15%.
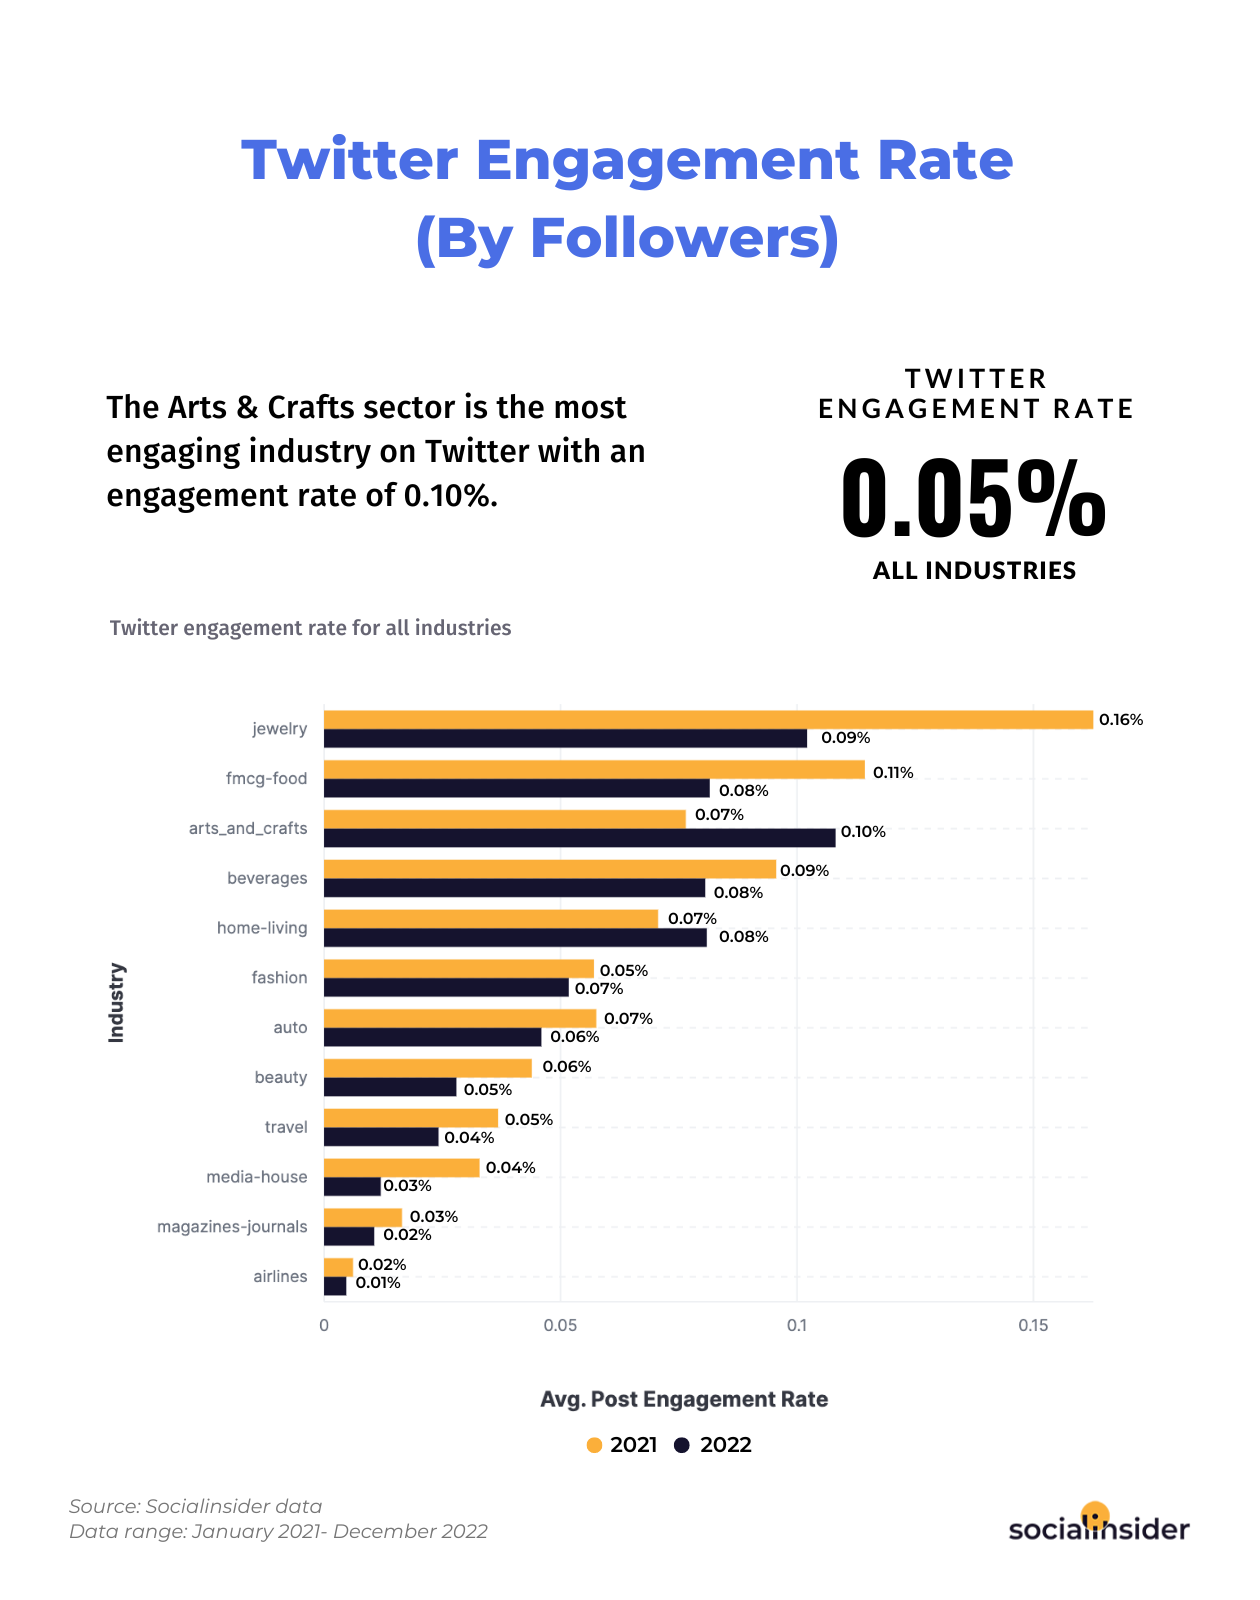
From an engagement rate standpoint, Twitter ranks last, with an engagement rate of 0.05% on average.
This means that brands whose stats fall beneath these scores need to put in a lot more effort into their social media strategies than industries from more engaging verticals, as well as manage their expectations when it comes to results.
How do we calculate the engagement rate on TikTok?
TikTok engagement rate is calculated as the sum of likes, comments, and shares on the post divided by the total number of posts. The result is then divided by the total number of followers and multiplied by 100.
When we’re talking about a video platform, there’s also another way of calculating the engagement rate on TikTok.
The engagement rate on TikTok can be calculated as the sum of likes, comments, and shares divided by the number of posts and then all divided by views.
We decided to adopt the first approach to have similar pillars of comparison when looking overall at all the social media platforms analyzed.
PS: Calculated based on video views, TikTok’s engagement rate records an average of 5.10%.
Social media engagement is declining on all platforms, including TikTok
With new apps, as well as more and more businesses emerging thanks to the highly dynamic business environment of today, the social media landscape is hit by a series of changes.
Across all the platforms, social media engagement is declining year by year.
With TikTok’s rising, the most impacted social media platform is Instagram, which got dethroned of its title of the most appealing network.
When looking at the numbers, the blow that Instagram suffered gets pretty obvious.
Comparing the insights we got by peeking at last year’s TikTok data for our 2023 social media engagement analysis with the ones available in our TikTok benchmarks study, which equally integrated some data from 2021, there’s an obvious engagement drop that even in the incredible TikTok engagement rate.
So far, from year to year, TikTok registered an average engagement rate decrease of 28%.
As for the most engaging industry on TikTok, which proved great skills in handling TikTok marketing and gaining an engagement that’s almost double compared to the platform’s average score, the beverages sector is the unquestionable leader.
Moving forward to Instagram, despite its noticeable engagement drops, there are still plenty of industries that are successful in maintaining their somehow high-performance levels compared to the platform’s overall rates.
While the food industry makes for the most engaging sector on Instagram, other business lines such as airlines, arts & crafts, travel, beverages, and alcohol still stand out from the crowd, with above-average engagement scores.
On the other hand, on Facebook, when speaking of industries that positively set themselves apart from the platform’s average engagement rates, there are only two winners: the beverages and food sectors.
With an average engagement rate pretty much flat for quite a while now on Twitter, there aren’t too many changes from an industry engagement shift perspective.
The runway for the most engaging industries on Twitter is made of: arts & crafts and jewelry – which get a double average engagement rate compared to the platform’s general score, altogether with the food industry.
Video content is the best-performing one across all social networks
TikTok’s incredible adoption rate and growth made it clear that video content is the next big wave for social media, being what users nowadays want to see primarily on social networks.
Given its many video format integrations over the years, based on an attempt to stay on top of the trends, it’s only fair to say that Instagram has the greatest experience with this content type.
After releasing its Reels feature a while back, the platform’s own version of short-form videos, not so long ago, Instagram has come up with one more significant change in its video integrations.
We’re talking here about the shift of all videos under 15 minutes into Reels.
This is obviously one of the network’s ways of pushing for increased usage of its today’s star feature, and it’s not the only one.
Let’s equally take a look at some engagement benchmarks.
According to data, Instagram Reels record an average engagement rate reaching up to 0.93%, which is almost double compared to the values of the other post types.
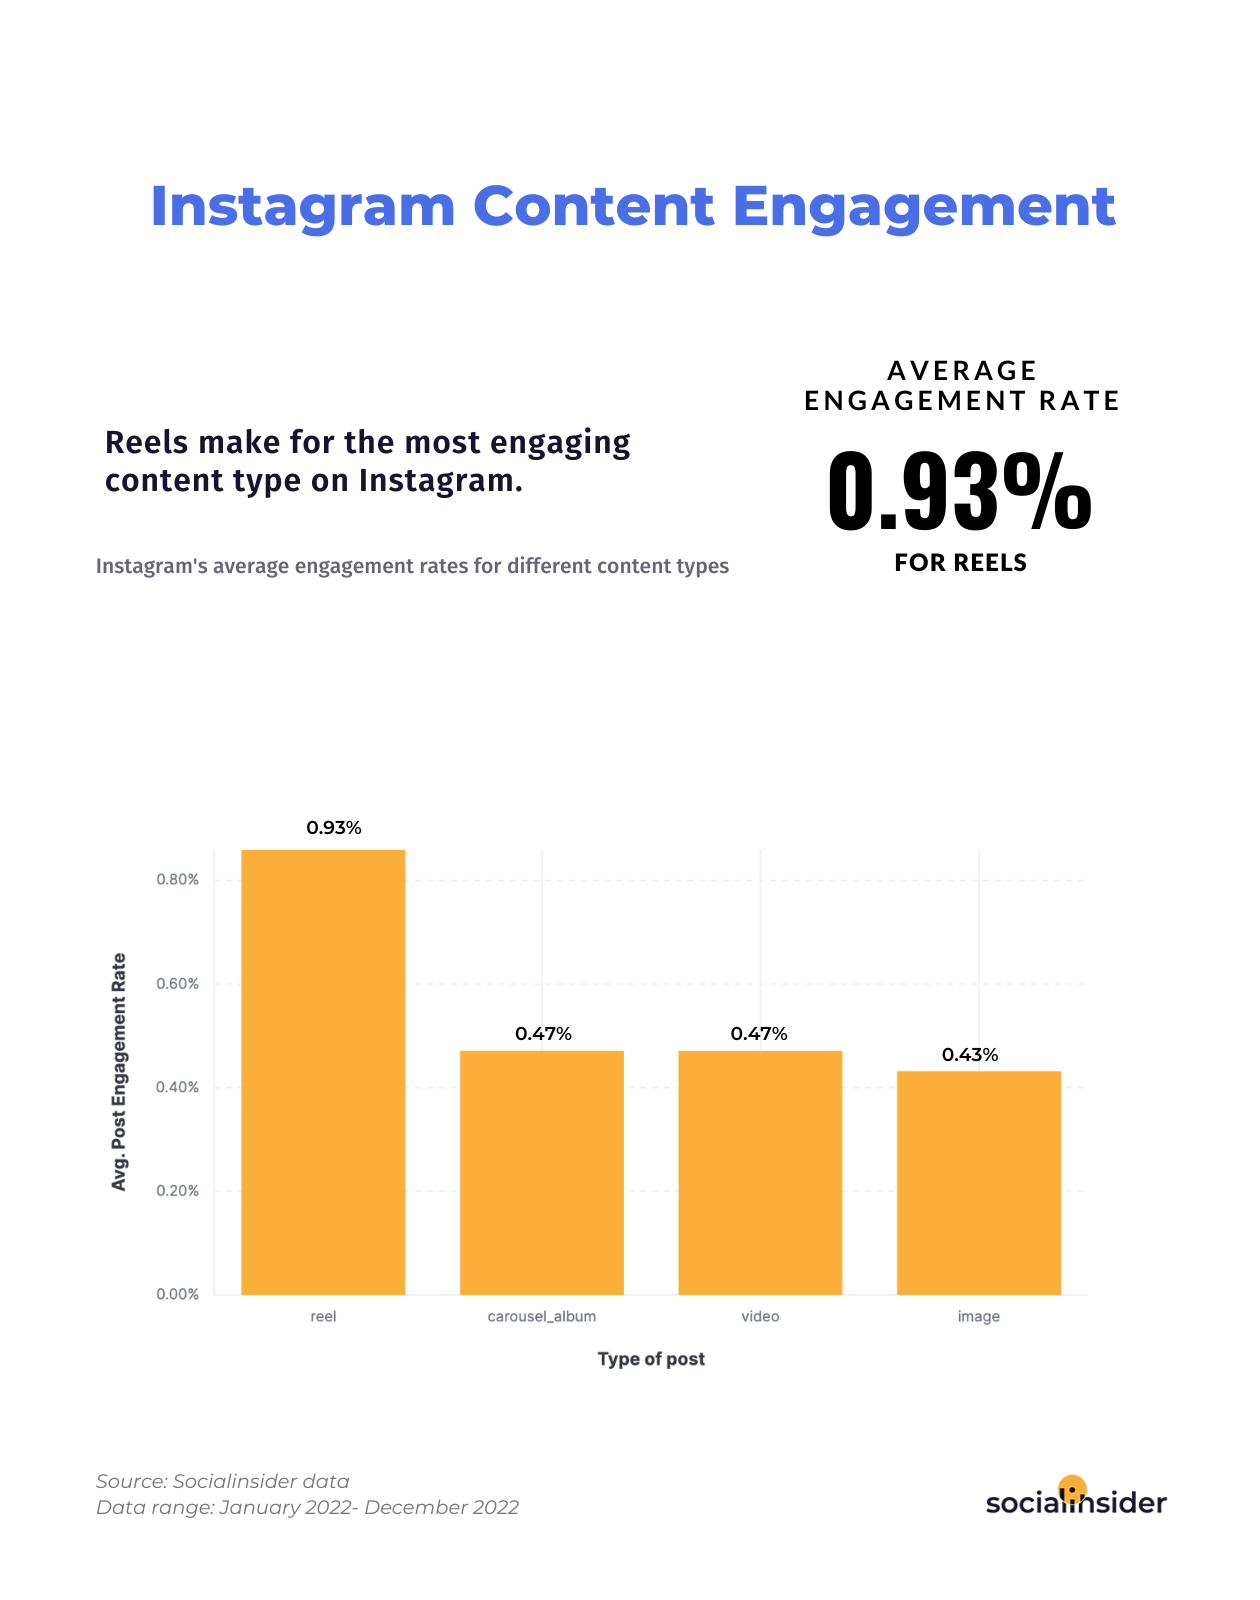
Reels’ higher engagement levels are also explicable through the feature’s double placement for exposure.
On the one hand, there’s the regular feed that displays all content types, including Reels.
And on the other hand, there’s the exclusively Reels video feed.
With the platform’s algorithm facilitating Reels’ viewership through multiple means, it is only natural for this feature to rank first for engagement generated on Instagram.
While the newer social media platforms, like Instagram or TikTok, are the real pioneers of video content’s popularity, older platforms – slowly but steadily – started to also integrate an increasing number of features for video content consumption.
Being among the newest features, Facebook Rooms or Reels make for some good examples.
As our industry benchmark data has indicated, following Instagram’s pattern, on Facebook as well, video post types record the highest engagement rate – of 0.17% on average.
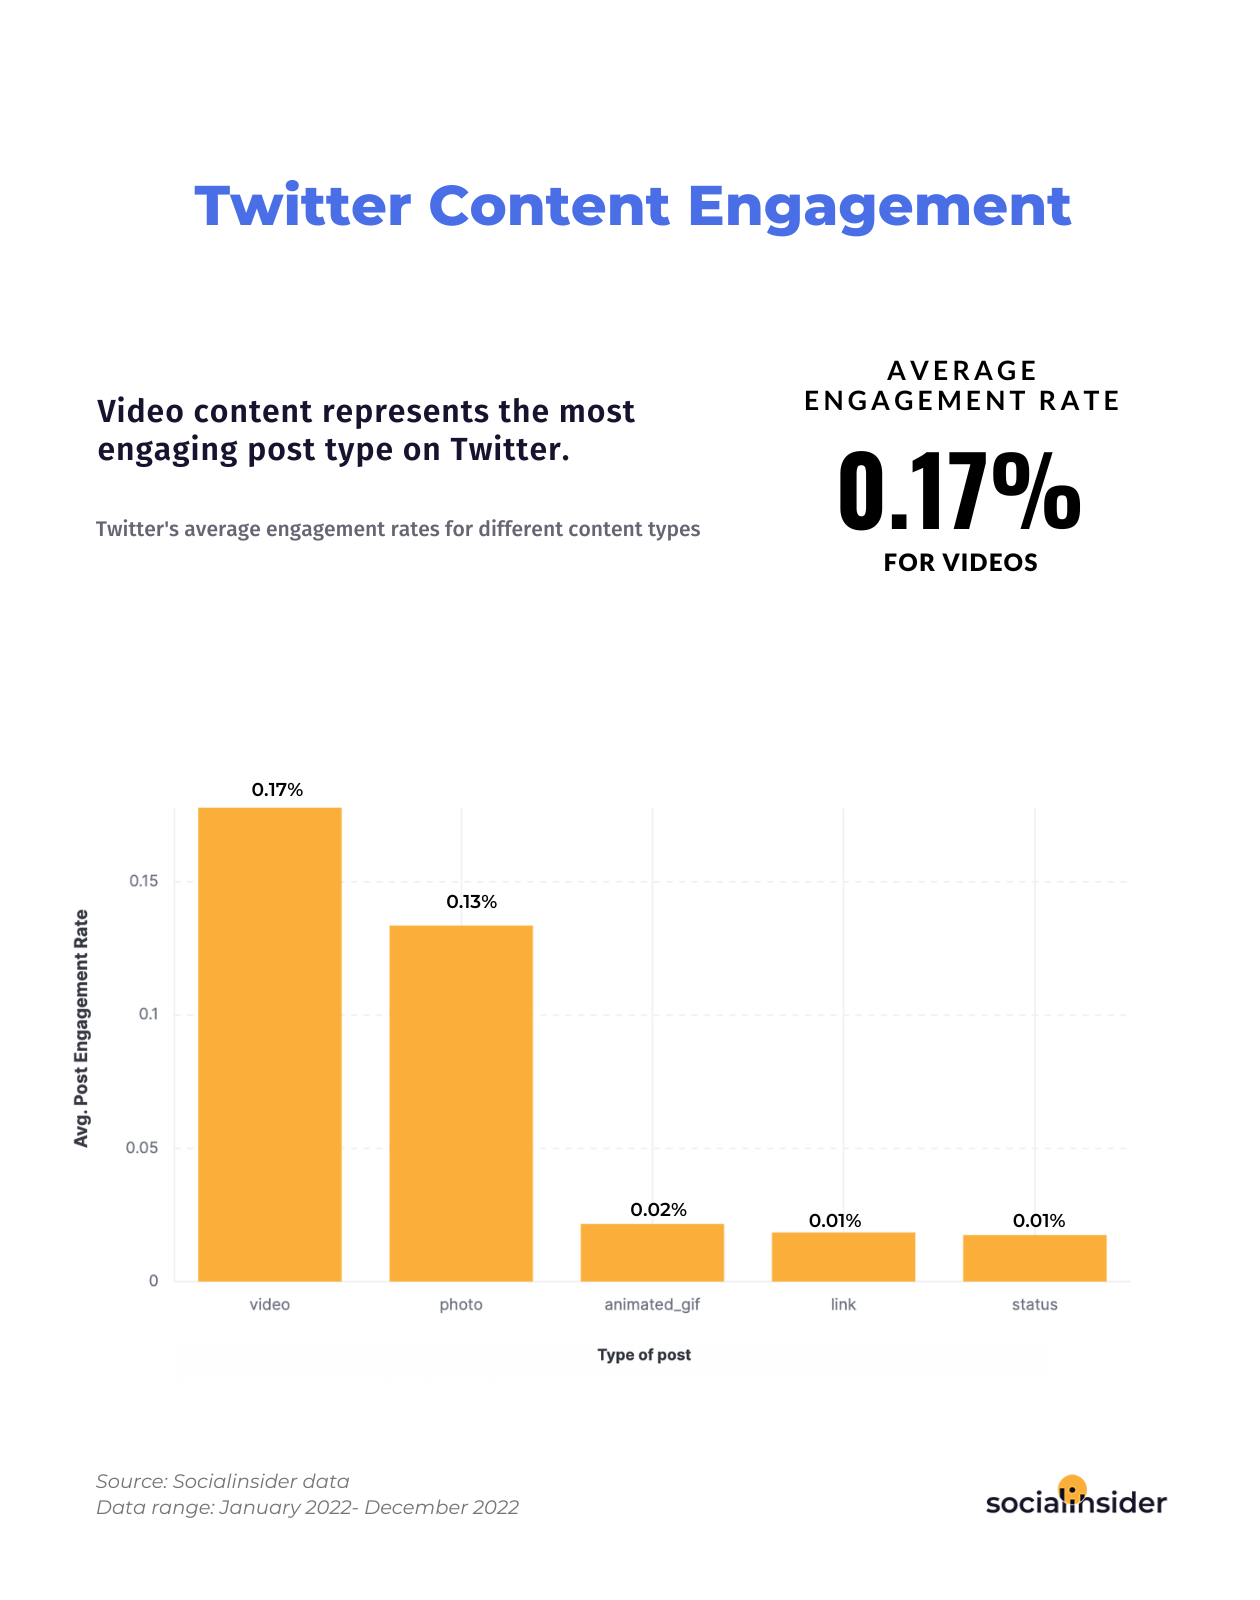
According to the data included in this social media benchmarks report, Twitter scores the lowest engagement rate overall.
However, a more in-depth analysis of every content type’s average engagement rate has revealed that video posts on Twitter can reach up to the same values they do on Facebook.
Surprisingly or not, it seems that by integrating more videos in their Twitter content calendar, brands active on this platform may get to an average engagement of 0.17% on average.
C. Industry-to-industry social media benchmarks
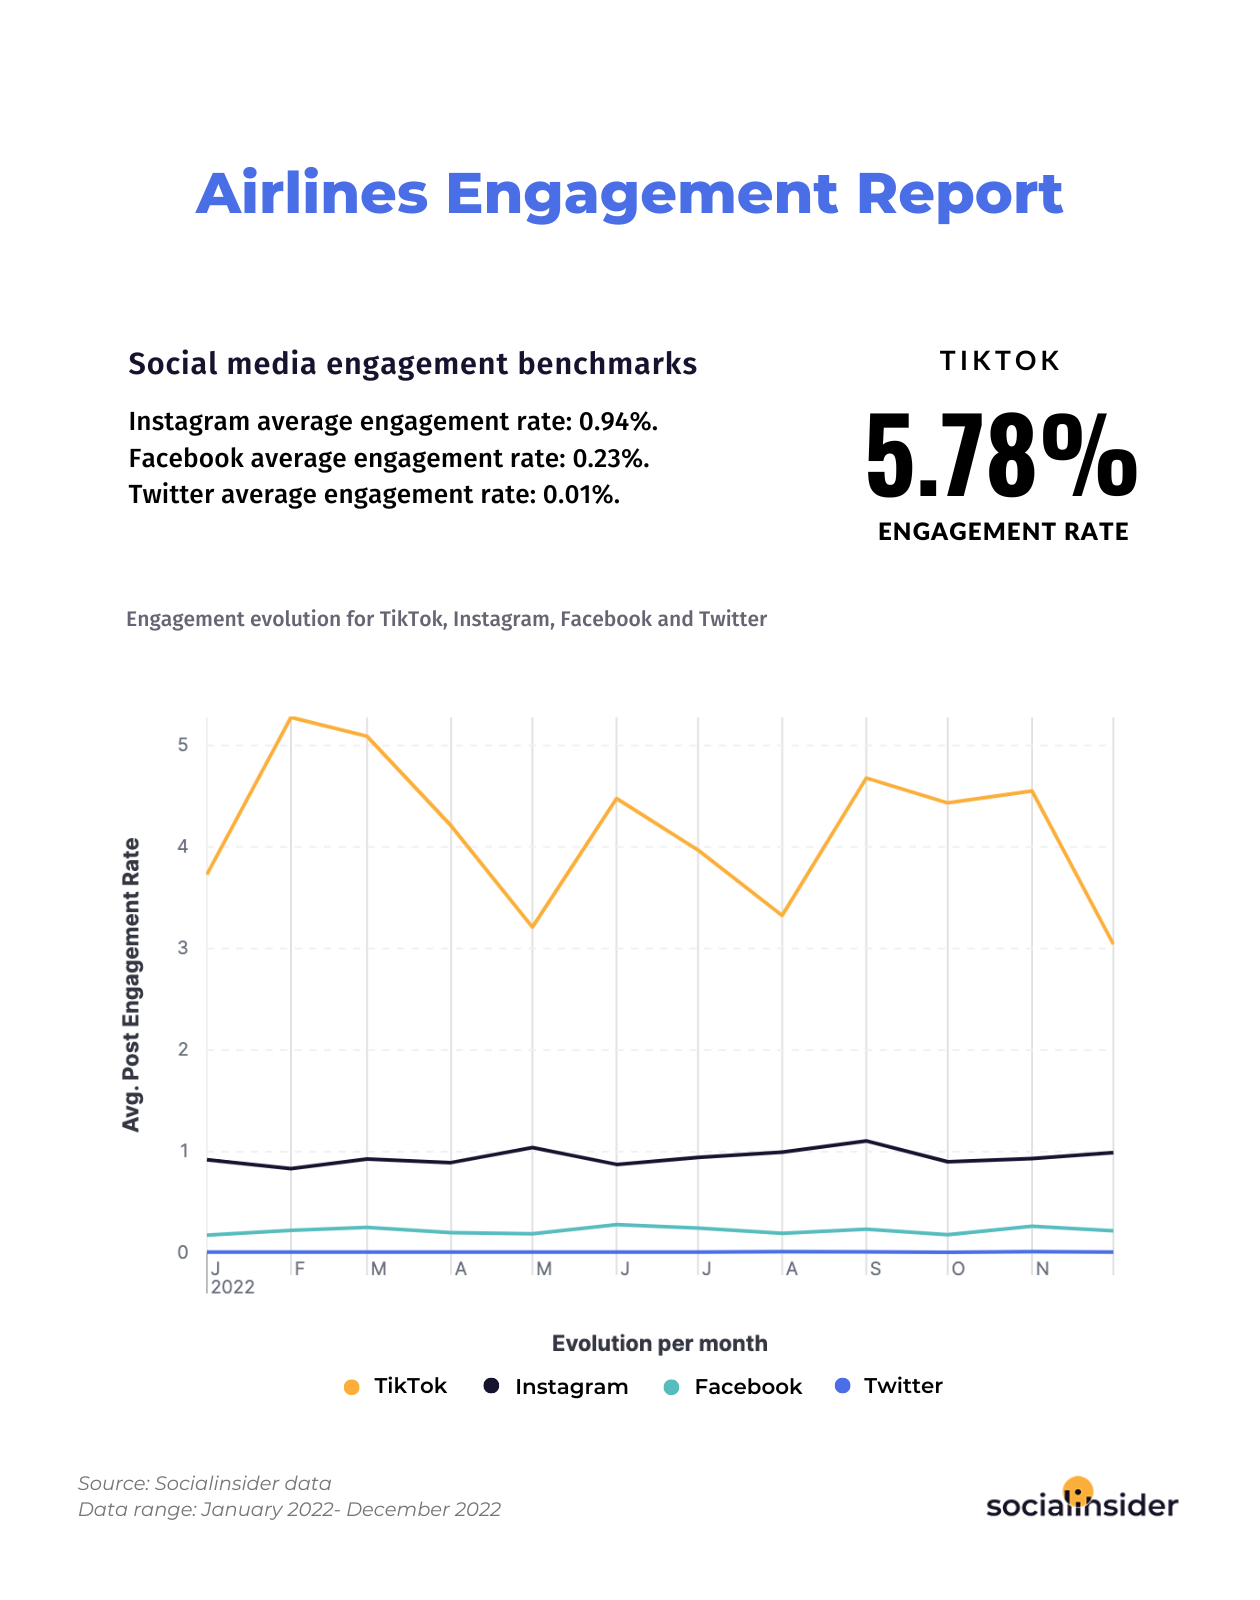
Airlines: social media engagement analysis
Brands within the airline industry have always known how to get the attention of social media users. For a long time now, this industry has actually been one of the top-performing ones on social media.
With famous companies like Ryanair – one of the most notorious brands on TikTok – being components of the sector, there’s no wonder where the high industry average social media engagement comes from.
As for more in-depth industry social media benchmarks, the airline sector scored on TikTok an average engagement rate of 5.78% and an average Instagram engagement rate of 0.94%.
When it comes to Facebook, the industry reaches a Facebook average engagement rate of 0.23%, and on Twitter, an engagement rate of 0.01% on average.
Scoring engagement rates that exceed the platform’s overall average values – on both TikTok and Facebook and lower on Twitter, is a clear sign that businesses within this category are focusing on the platforms where their target audiences are.
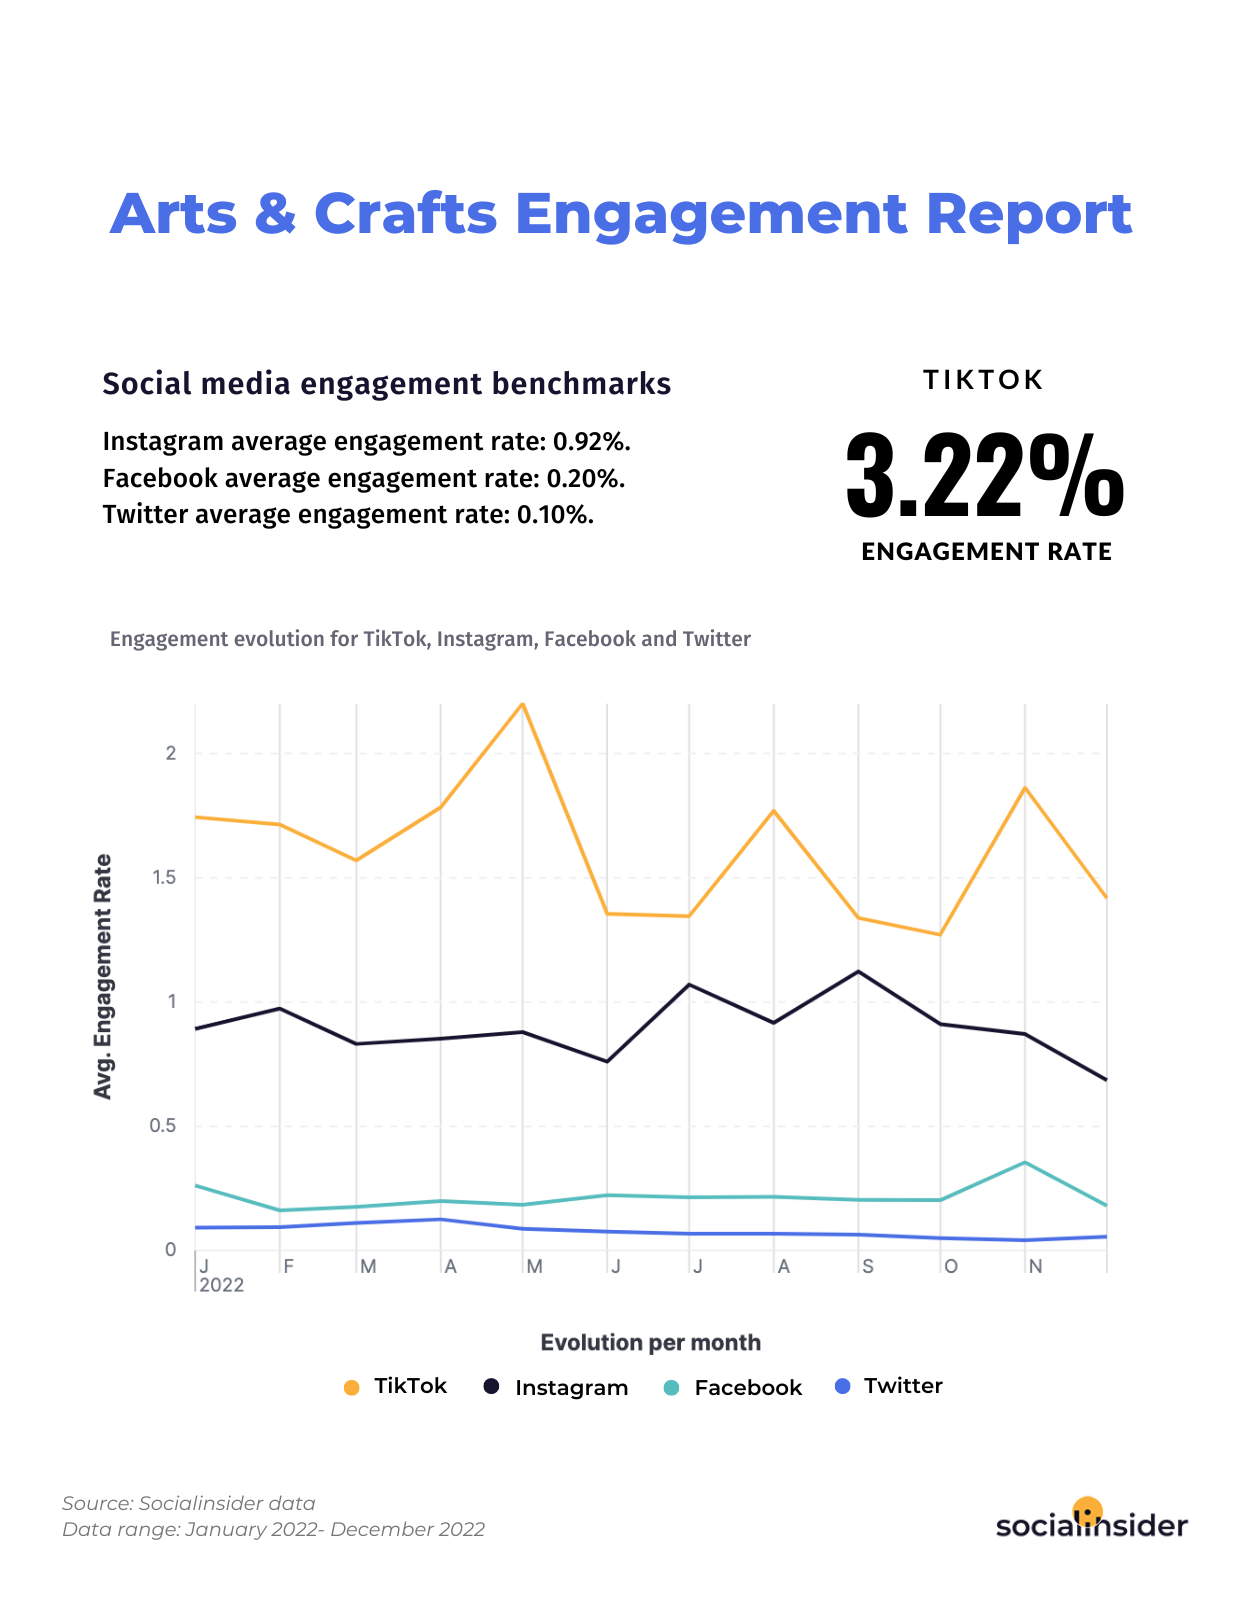
Arts & Crafts: social media engagement analysis
There’s old news by now that nowadays TikTok holds the crown for the most engaging social media platform. So, it’s also quite expected for this to apply in the case of particular industries as well.
While having an average engagement rate of 3.22% on TikTok, this is one of the industries that fall behind the platform’s average score.
This may partly happen because the arts & crafts sector is a rather niched and smaller one that may not integrate so many brands investing significant budgets and resources into social media marketing.
When it comes to the second-best performing platform – which is Instagram- for the arts & crafts industry, as well as in general, the sector scores an Instagram average engagement rate of 0.92%. Which we have to admit – is a pretty good value considering the network’s overall average.
As for more industry benchmarks for social media for this market – it registers a Facebook average engagement rate of 0.20% and a Twitter average engagement rate of 0.10%.
Automotive industry: social media engagement analysis
Judging by the industry benchmarks for social media and the data revealed for this sector, it would seem that 2022 was a year with multiple ups and downs for brands within the automotive line of business.
During the first quarter of 2022, the automotive industry registered a short spike in the average Instagram engagement rate, followed by a pretty much flat line for the rest of the year.
At the moment, the industry’s average engagement rate on Instagram reaches an average of 0.78%, which is not too far located from the platform’s overall average engagement values.
On TikTok, on the other hand, despite the industry’s higher engagement values, the end of 2022 has signaled a potential engagement drop.
Truth be told, even TikTok’s almighty engagement levels have started to decrease little by little year after year. With this possibly being one of the reasons, automotive brands should, nevertheless, run a comparative performance audit integrating older, more effective TikTok marketing campaigns to get more content insights.
Back to the data, at the moment, the automotive industry reaches an average TikTok engagement rate of 4.55%.
PS: Using a social media analytics tool can help you simplify the audit process and gain more time to get to the bottom of the numbers so that you can optimize your TikTok marketing strategy.
Start with a 14-day Socialinsider free trial, get into the nitty-gritty of data using our TikTok analytics feature, and gain insights that will help you become the next TikTok star!
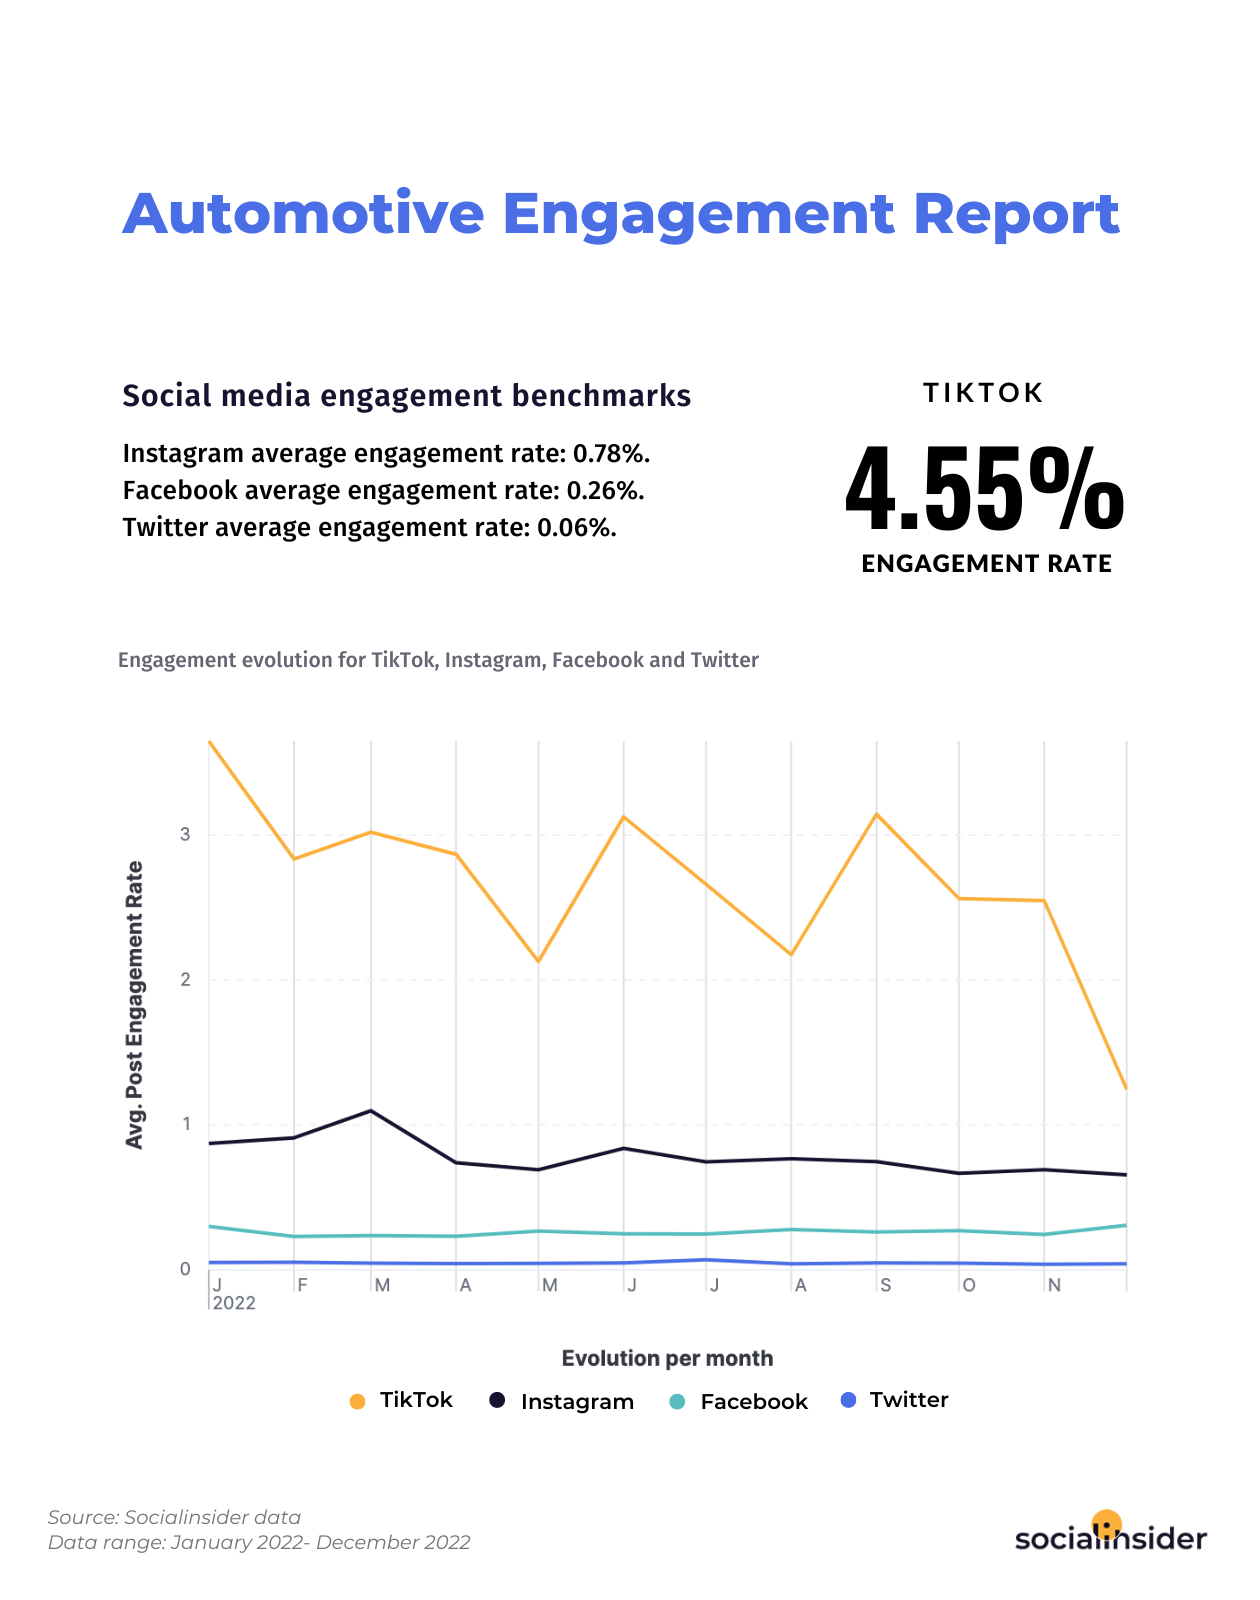
Last but not least, the automotive industry scored an average Facebook engagement rate of 0.26% and an average Twitter engagement rate of 0.06%.
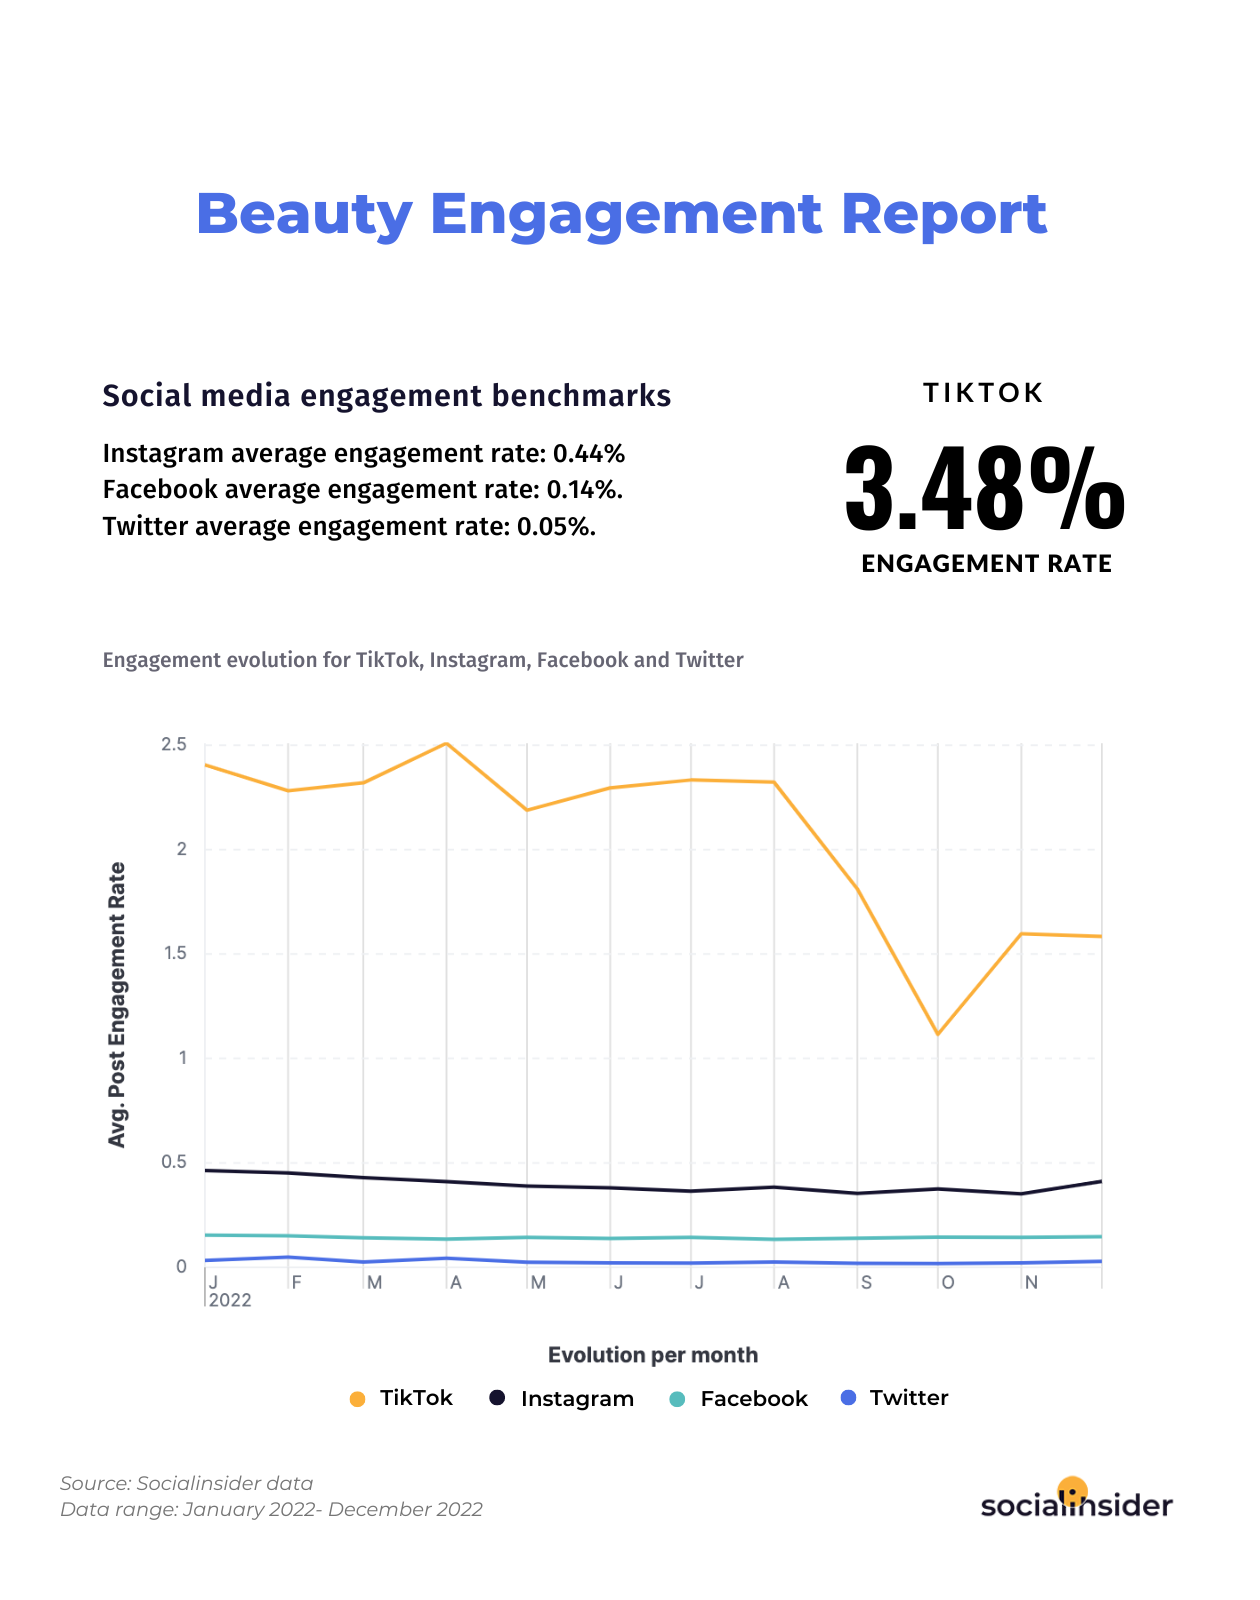
Beauty: social media engagement analysis
Despite TikTok’s high engagement potential, there’s no guarantee all brands and industries would make it on the platform, as the beauty industry’s engagement rate reveals.
From an average engagement rate standpoint, beauty brands are underperforming on social these days, having the following values: 3.48% on TikTok, an 0.44% Instagram engagement rate, and 0.14% on Facebook. As for the Twitter engagement rate, this industry is located at an average of 0.05%.
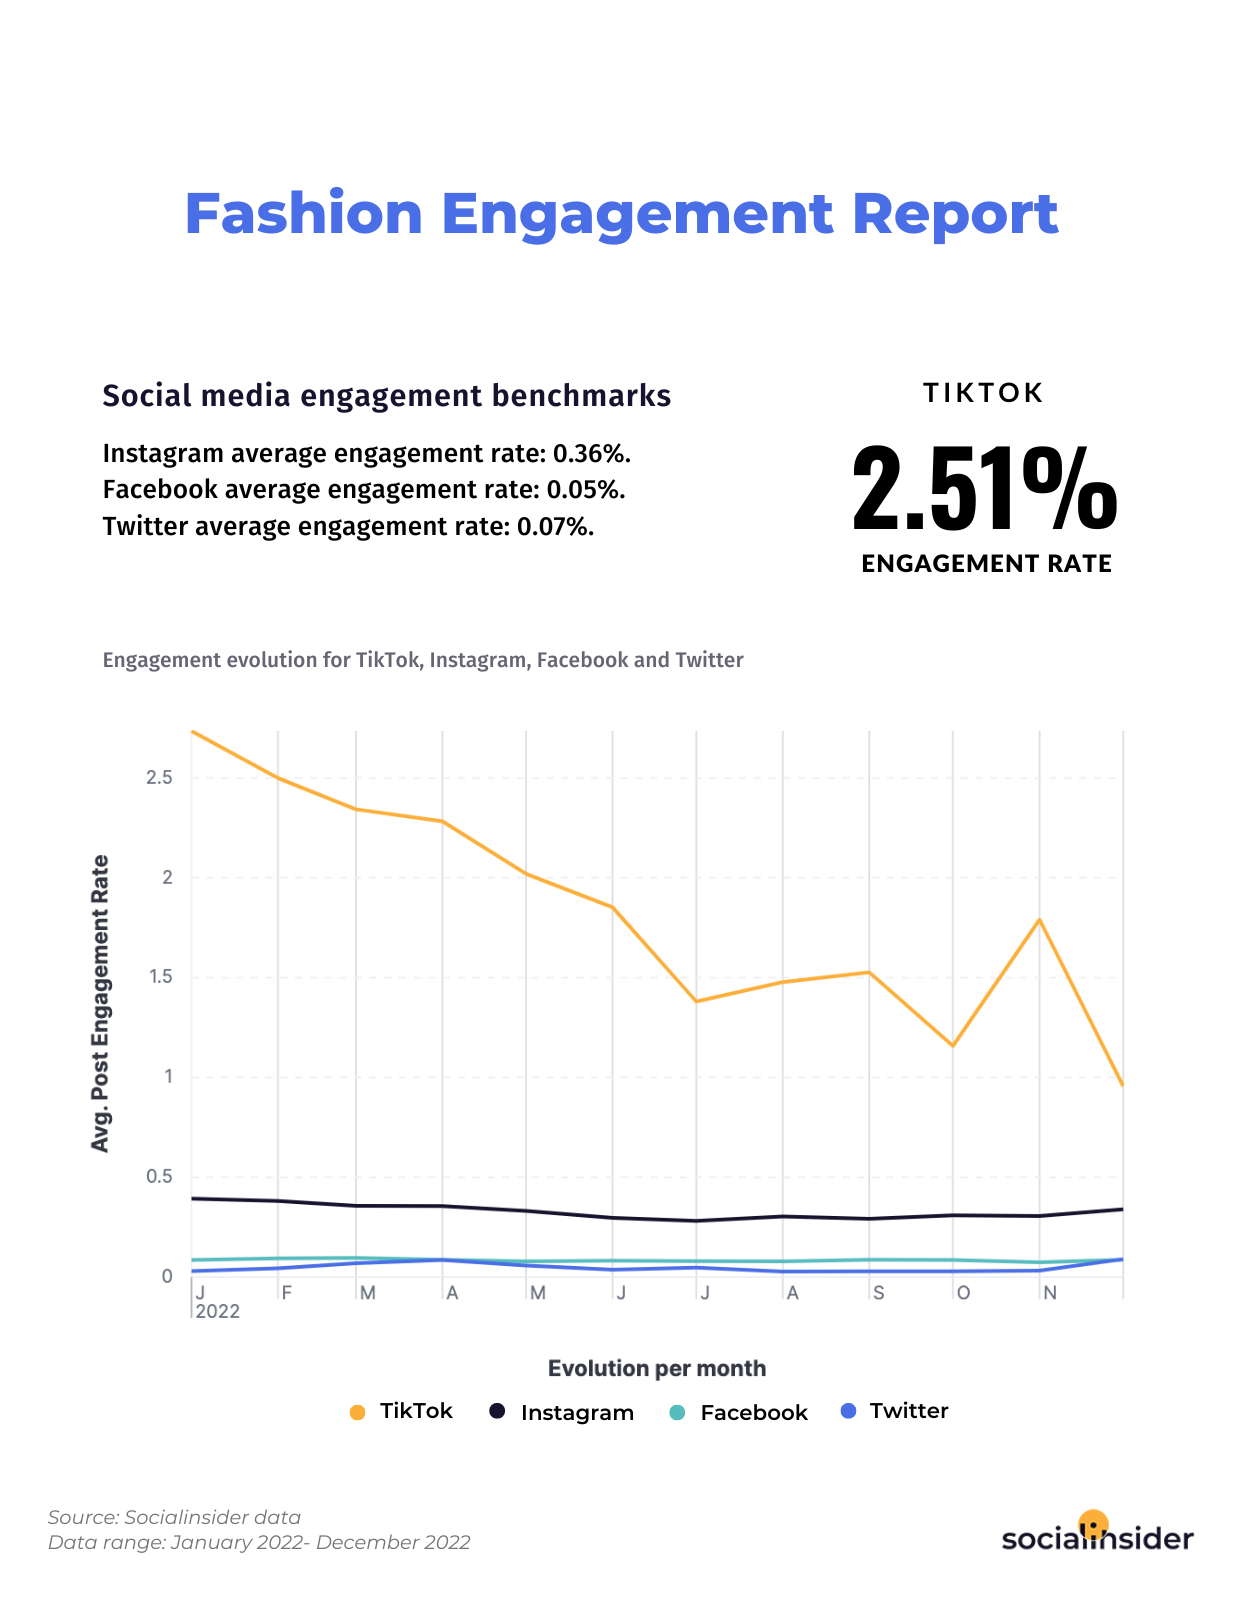
Fashion: social media engagement analysis
When looking at the fashion industry’s social media performance benchmarks, we discovered a striking TikTok engagement decrease.
While the first quarter of 2022 was a relatively good time in terms of TikTok engagement recorded, throughout the rest of the year, the industry’s average TikTok engagement rate went on a weighty dropping path.
Registering an average TikTok engagement rate of 2.51%, the fashion industry is the least-performing sector on this platform, and not only.
Having an Instagram average engagement rate of 0.36% and a Facebook engagement rate of 0.05% on average, the fashion industry is the least engaging sector on Instagram and Facebook as well.
As far as engagement on Twitter goes, fashion brands reach an average Twitter engagement rate of 0.06%.
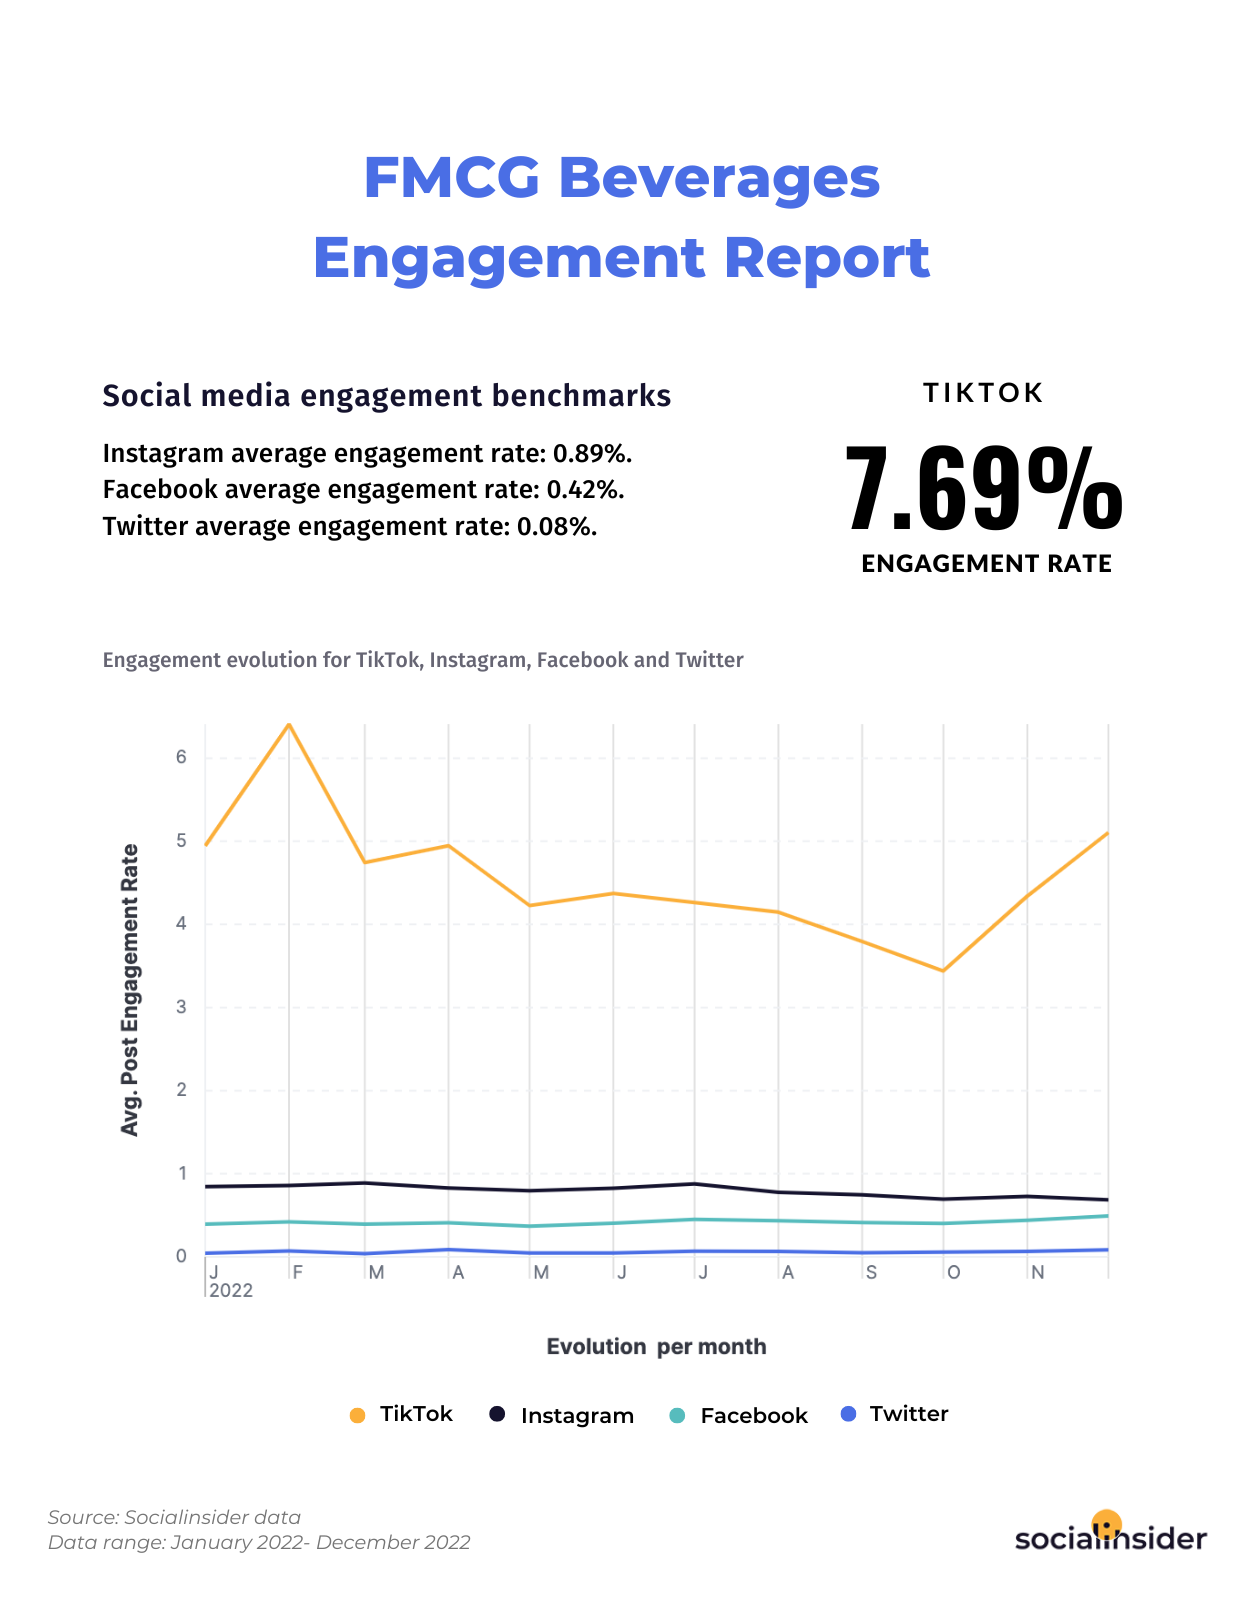
FMCG – Beverages: social media engagement analysis
Judging by its engagement levels across all the social media platforms and its ascending trajectory on TikTok, it seems that brands from the beverages industry centered their strategy towards one goal in 2022: creating a solid TikTok presence.
Although brands from the beverages industry faced a huge decrease in the average TikTok engagement rate over the middle of 2022, they seem to have bounced back toward creating a successful strategy with the year ending.
With an average TikTok engagement rate of 7.69%, the beverages sector ranked first for last year’s most engaging industry within the platform.
On Instagram, the beverages industry reaches an average engagement rate of 0.89%, while on Facebook, the sector’s average engagement rate goes up to 0.42%, equally scoring the highest values.
Speaking of this industry’s great social media results as per these social media industry benchmarks, this business market’s Twitter engagement rate also tops the platform’s overall values, registering an average of 0.08%.
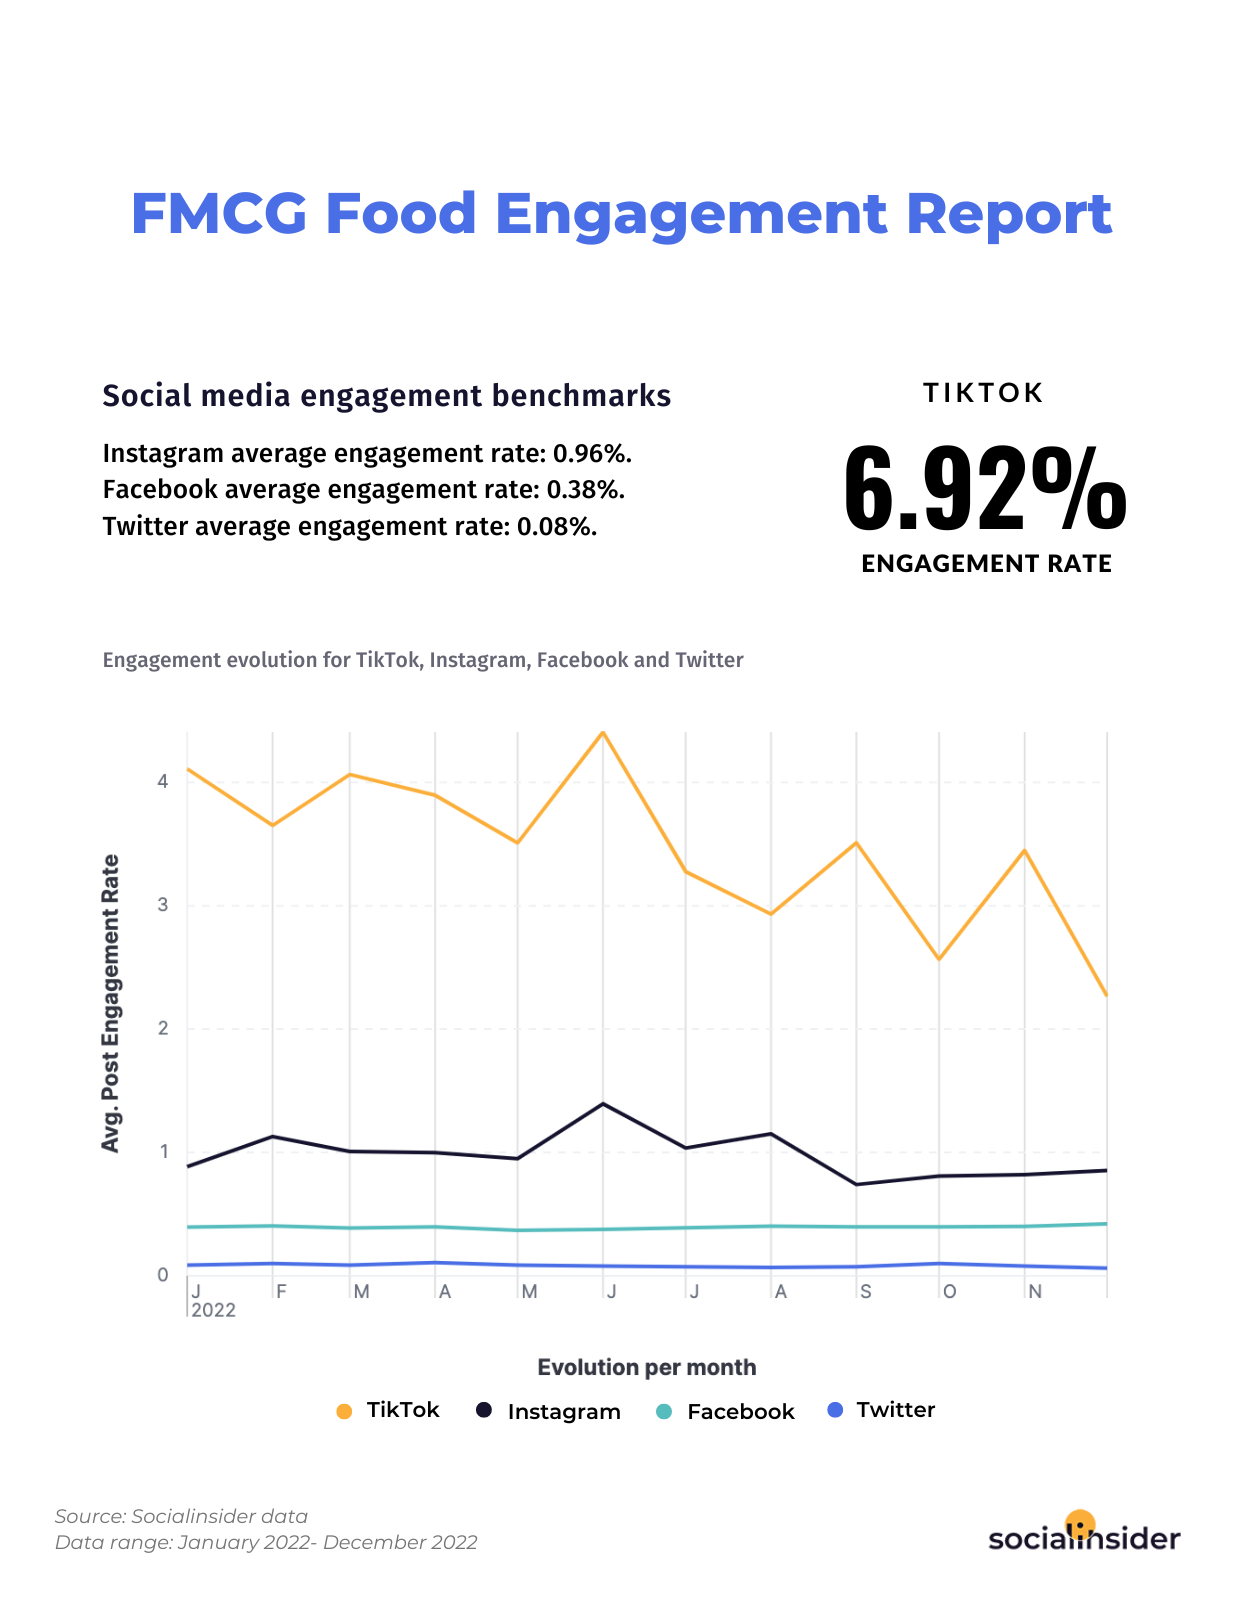
FMCG – Food: social media engagement analysis
Overall, engagement for the food industry is pretty high – scoring second place for best-performing industries on social media in three out of four cases, namely on TikTok, Instagram, and Facebook.
Similar to other industries, over 2022, the food business line has also faced some fall downs in its average TikTok engagement rate.
However, given other sectors’ still impressive results, we can say that not all hope is lost. And for businesses within the food sector, there’s certainly room for improvement – on TikTok especially.
What’s also interesting about this industry is its performance evolution on Instagram, which – based on its significant spikes in engagement over 2022 – seemed to have found plenty of effective strategies for Instagram marketing.
To wrap things up with this industry’s social media benchmarks, here are the average engagement rates across all social platforms:
- TikTok: average engagement rate of 6.92%;
- Instagram: average engagement rate of 0.96%;
- Facebook: average engagement rate of 0.38%;
- Twitter: average engagement rate of 0.08%.
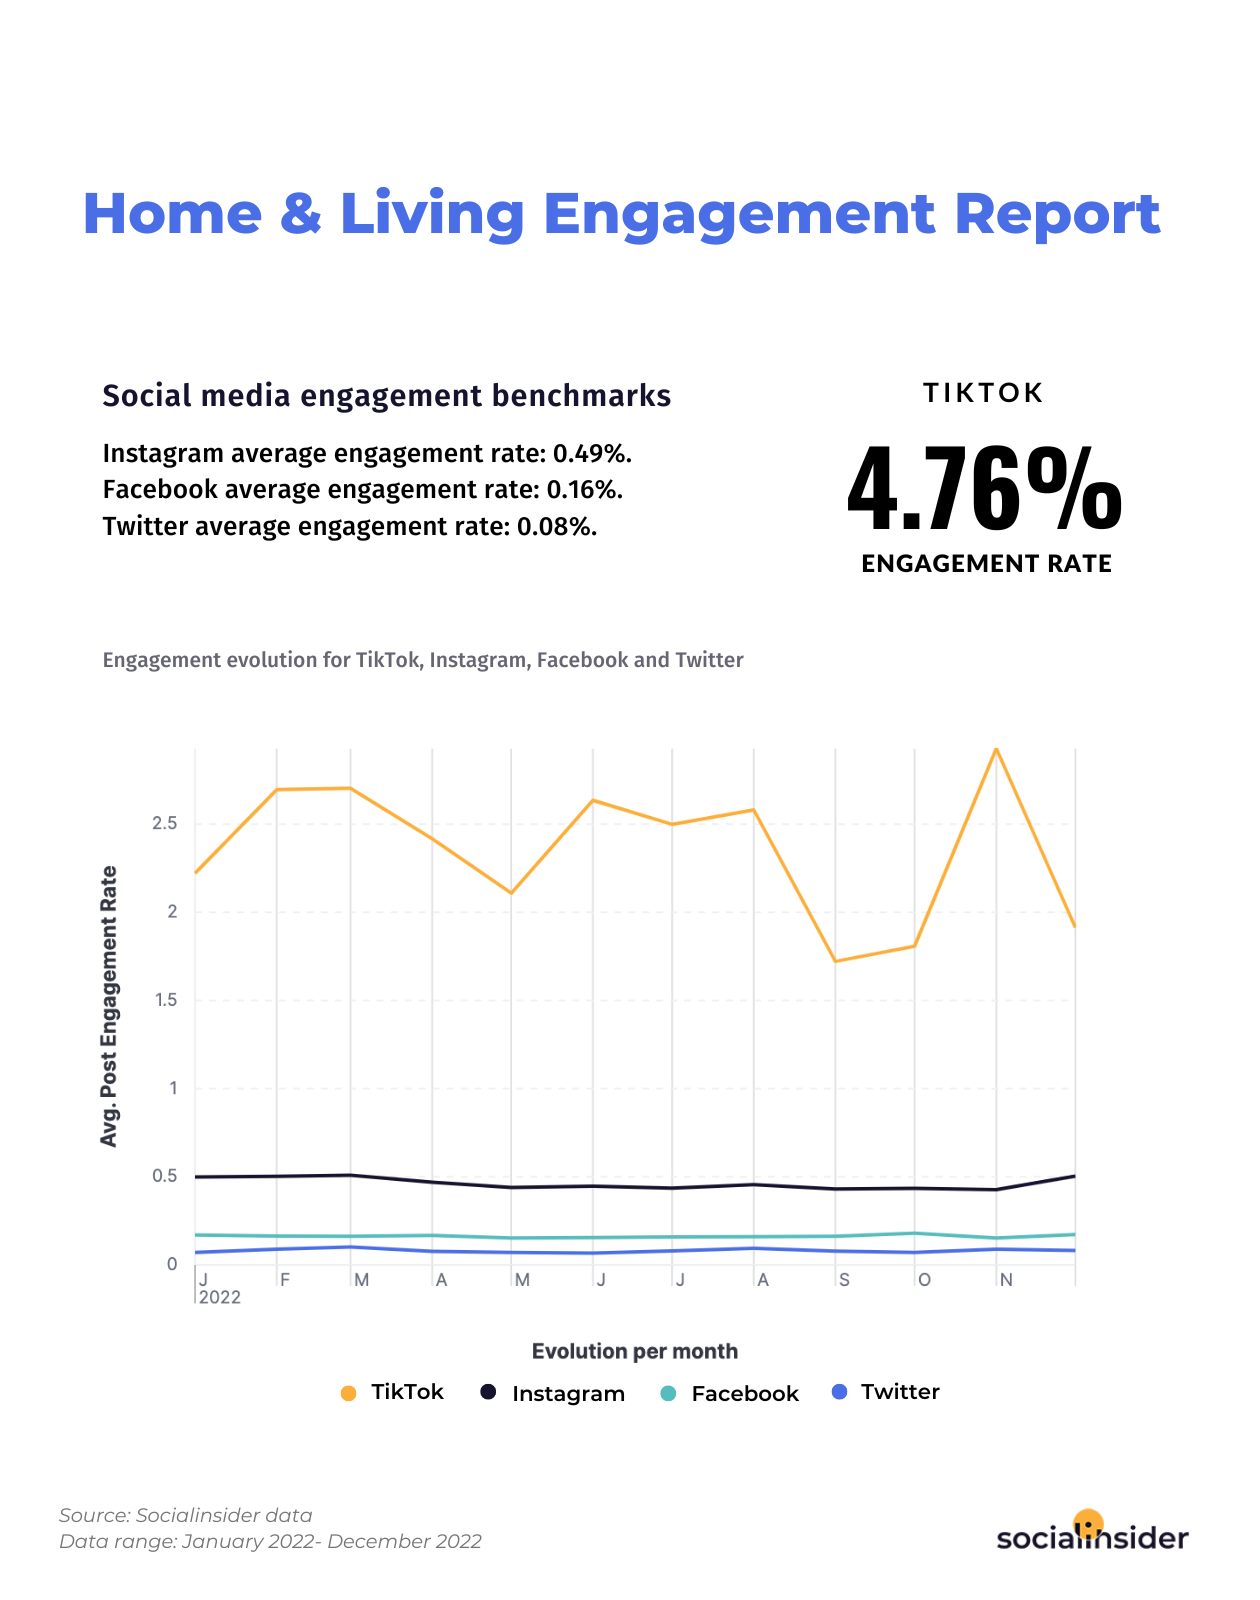
Home & Living: social media engagement analysis
For brands within the home & living industry, 2022 did not spark significant fluctuations in the average TikTok engagement rate, except for the months of October and November.
May that be due to the beginning of the holiday season – when people become all excited about decorating their homes and get deeper into the holiday spirit?
It’s quite possible.
Anyway, looking at the overall engagement rates per post, brands from the home & living industry recorded the following average values: 4.76% on TikTok, 0.49% on Instagram, 0.16% on Facebook, and 0.08% on Twitter.
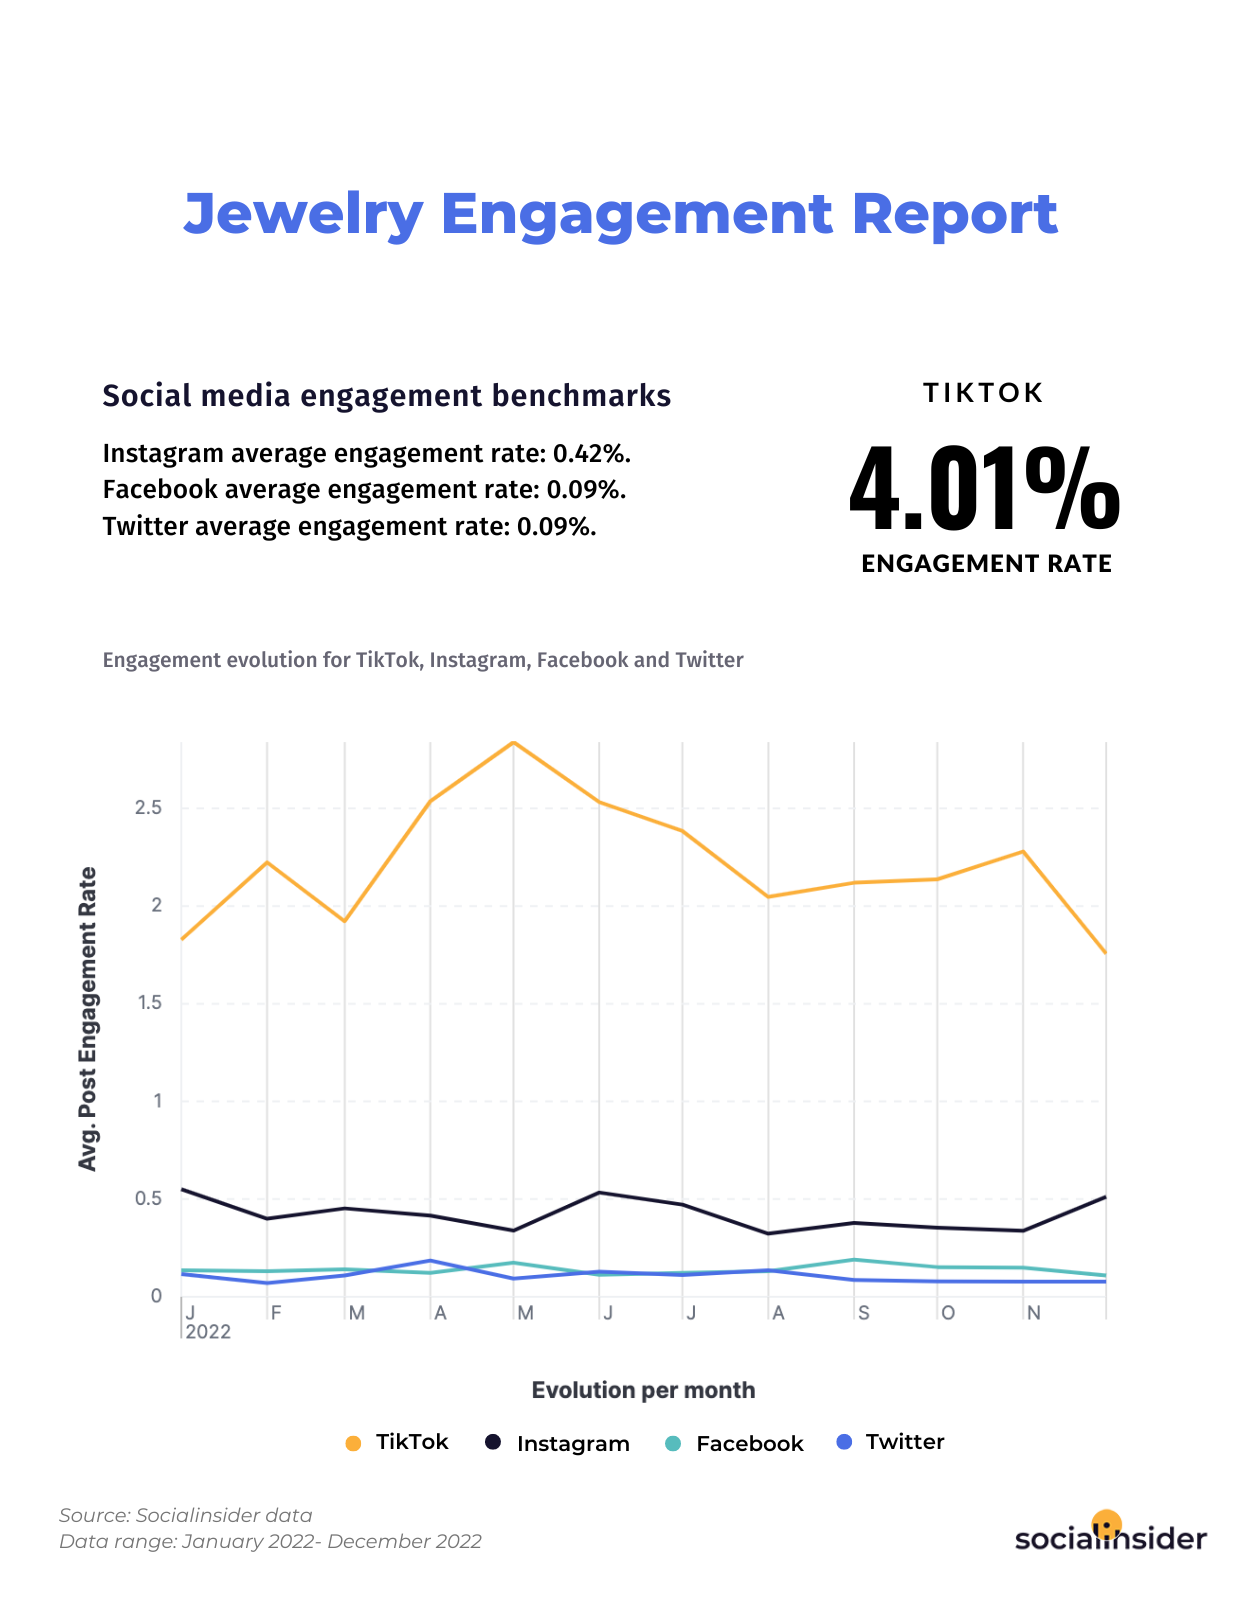
Jewelry: social media engagement analysis
Overall, social media engagement for the jewelry business line is pretty low – even with TikTok in the game – scoring below the platform’s average rates on most social networks.
Jewelry brands reach an average TikTok engagement rate of 4.01%, a 0.42% Instagram engagement rate, an Facebook engagement rate of 0.09%, and a Twitter engagement rate of 0.09% on average.
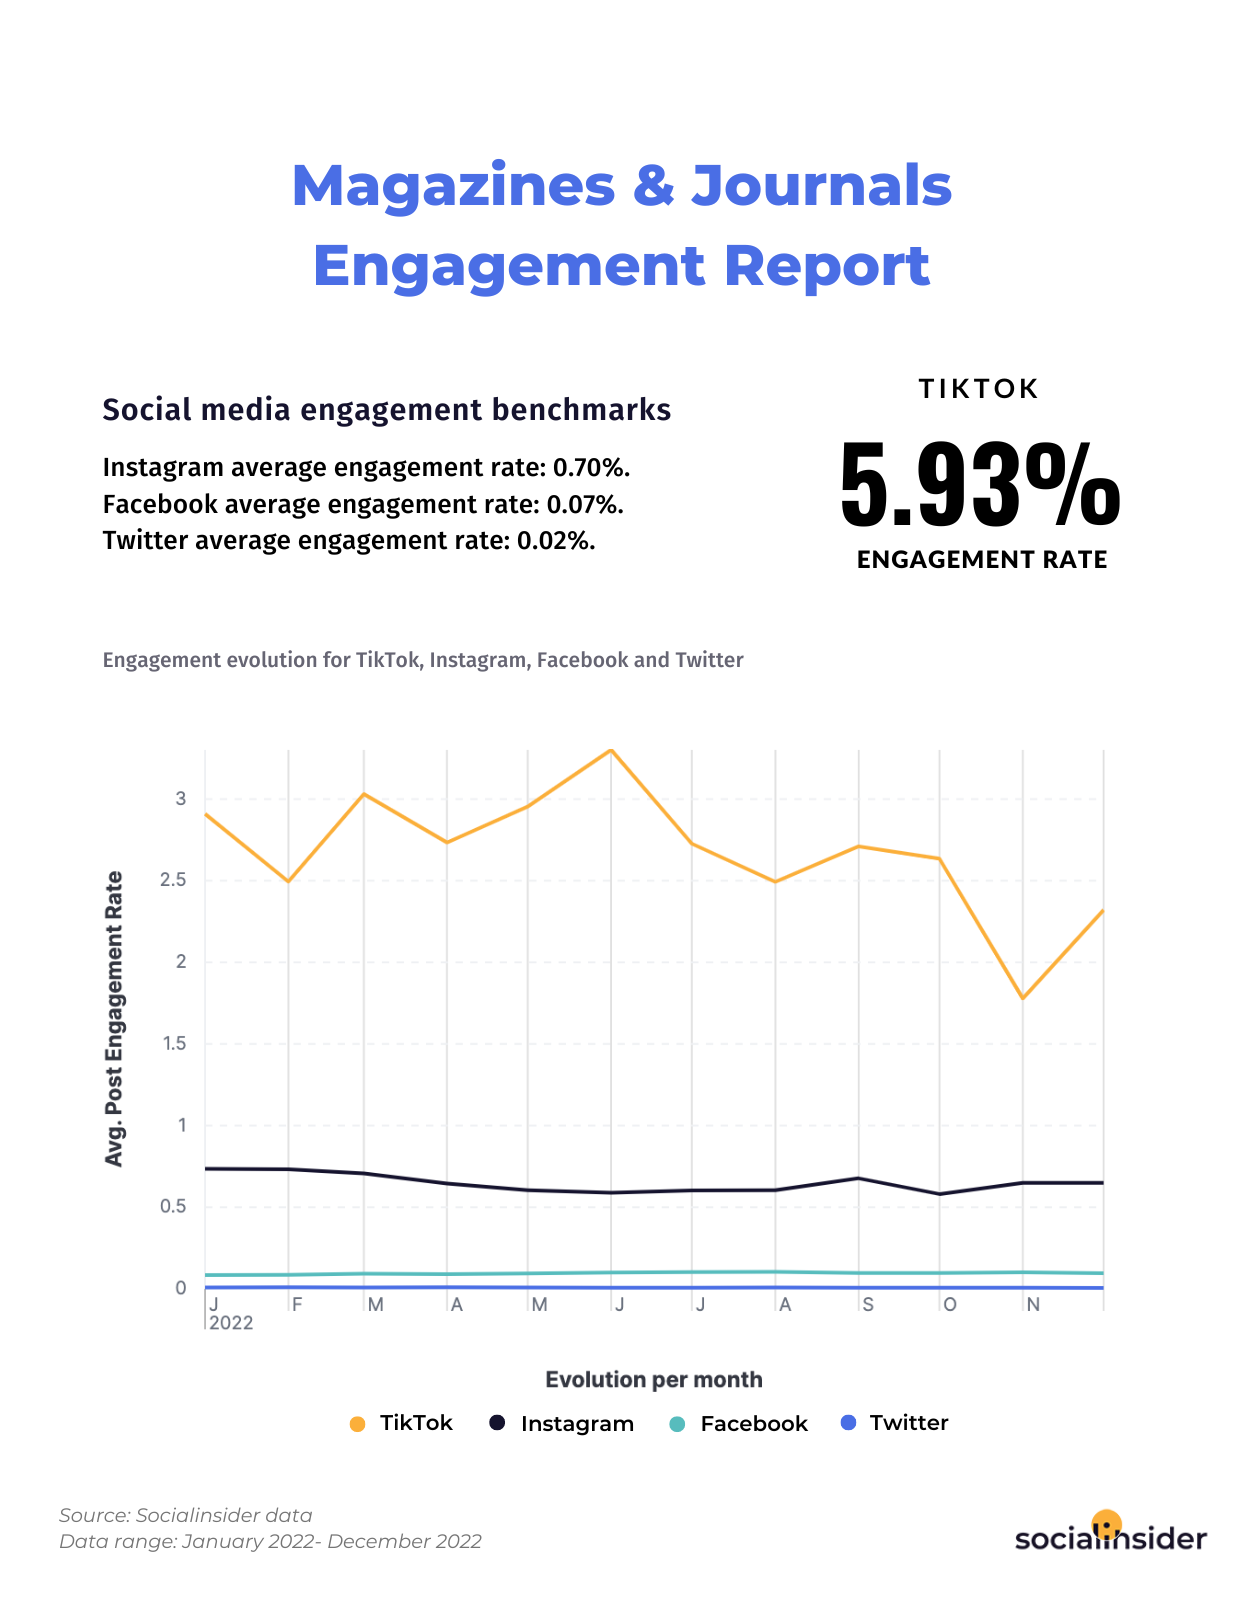
Magazines & Journals: social media engagement analysis
Brands from the magazines & journals industry count to those that in 2022 have shifted their social content strategy in an attempt to make the most out of the exposure potential of TikTok. Which – up to a point – they did.
But with TikTok marketing, everything is still a gamble.
While the first half of 2022 seemed to have taken the magazines & journals industry on the right path for greater social engagement, toward the second half of the year, the numbers started to slide down significantly.
Surprisingly enough, the magazine & journals industry is one of the best-performing ones on TikTok at the moment, having a TikTok average engagement rate of 5.93%.
On the other hand, when it comes to the other social media platforms, this industry registered the following engagement benchmarks: 0.70% average engagement rate on Instagram, 0.07% on Facebook, and 0.02% on Twitter.
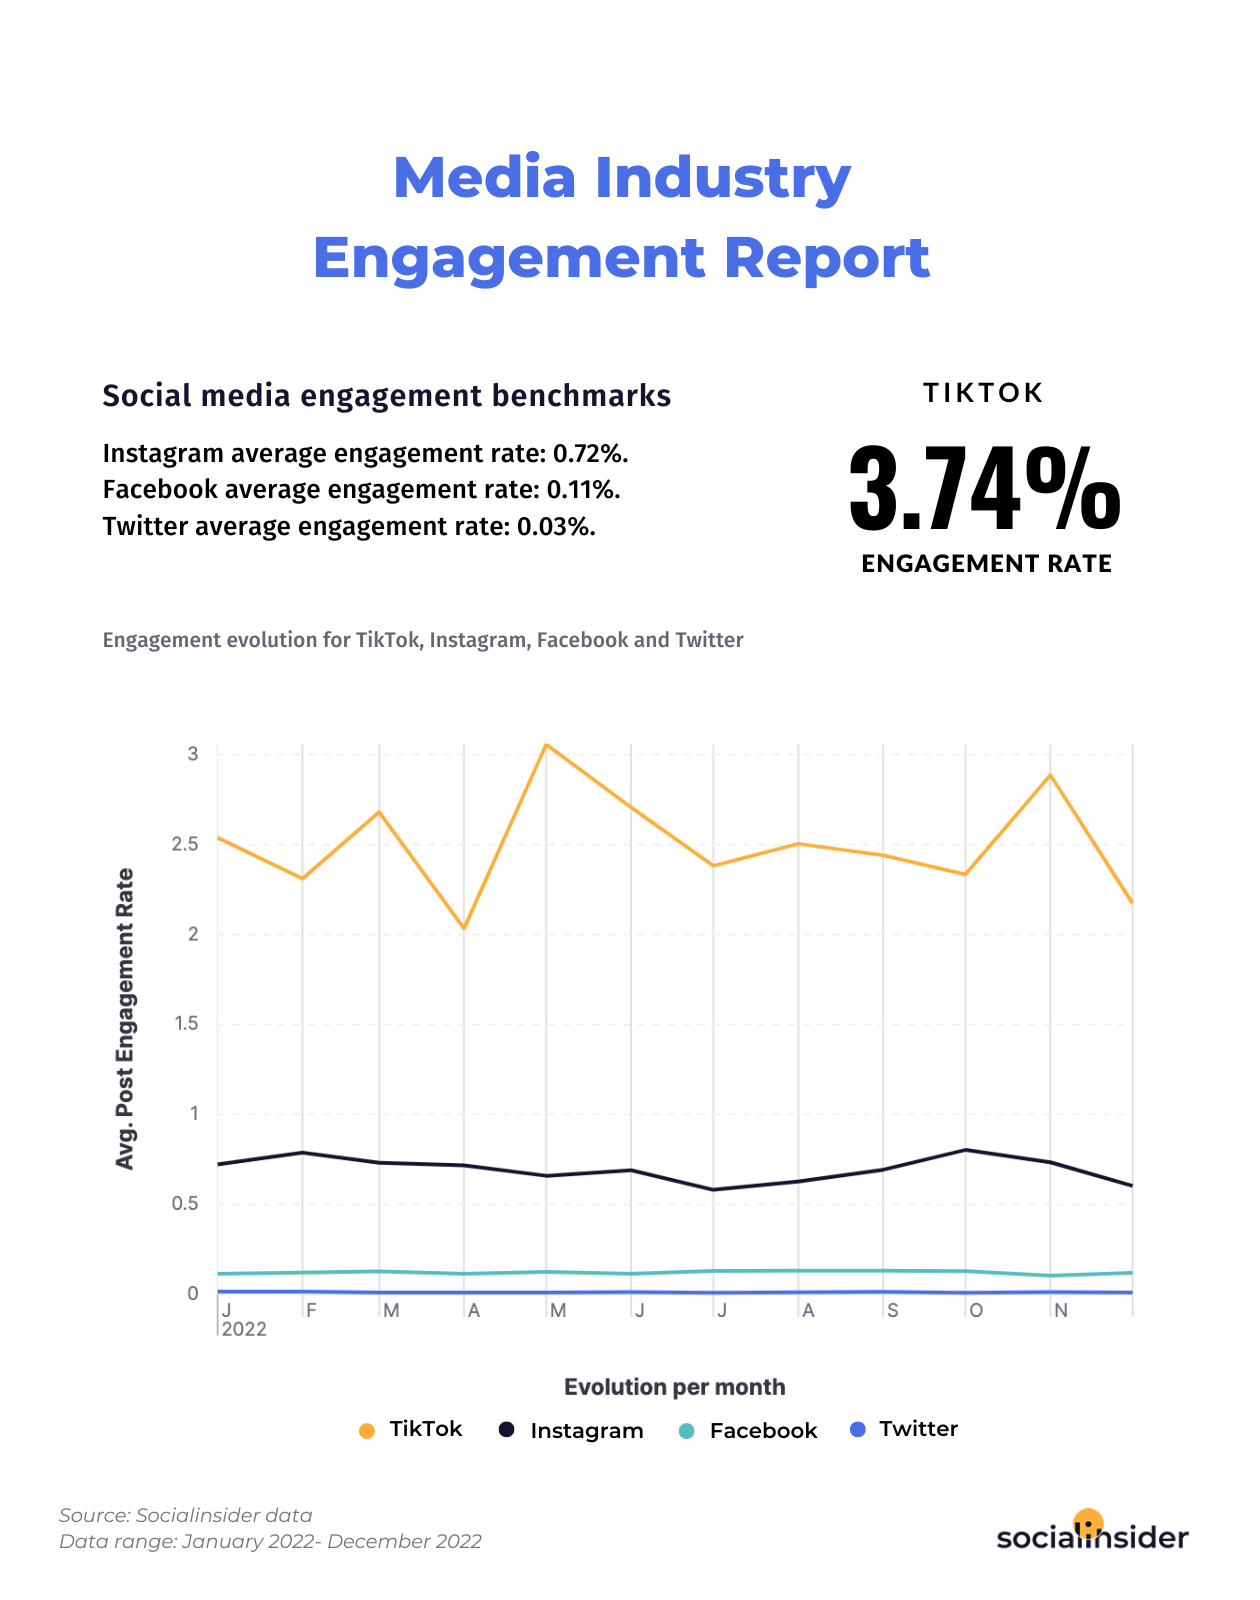
Media industry: social media engagement
Pages that represent the media industry fail to engage with their audience as much as other industries have proven to do.
From an engagement rate standpoint, brands within these industries have recorded average values that are below the platform’s standards.
Media brands reach a TikTok average engagement of 3.74%, a 0.78% average engagement rate on Instagram, a Facebook engagement rate of 0.11% on average, and a Twitter average engagement rate of 0.03%.
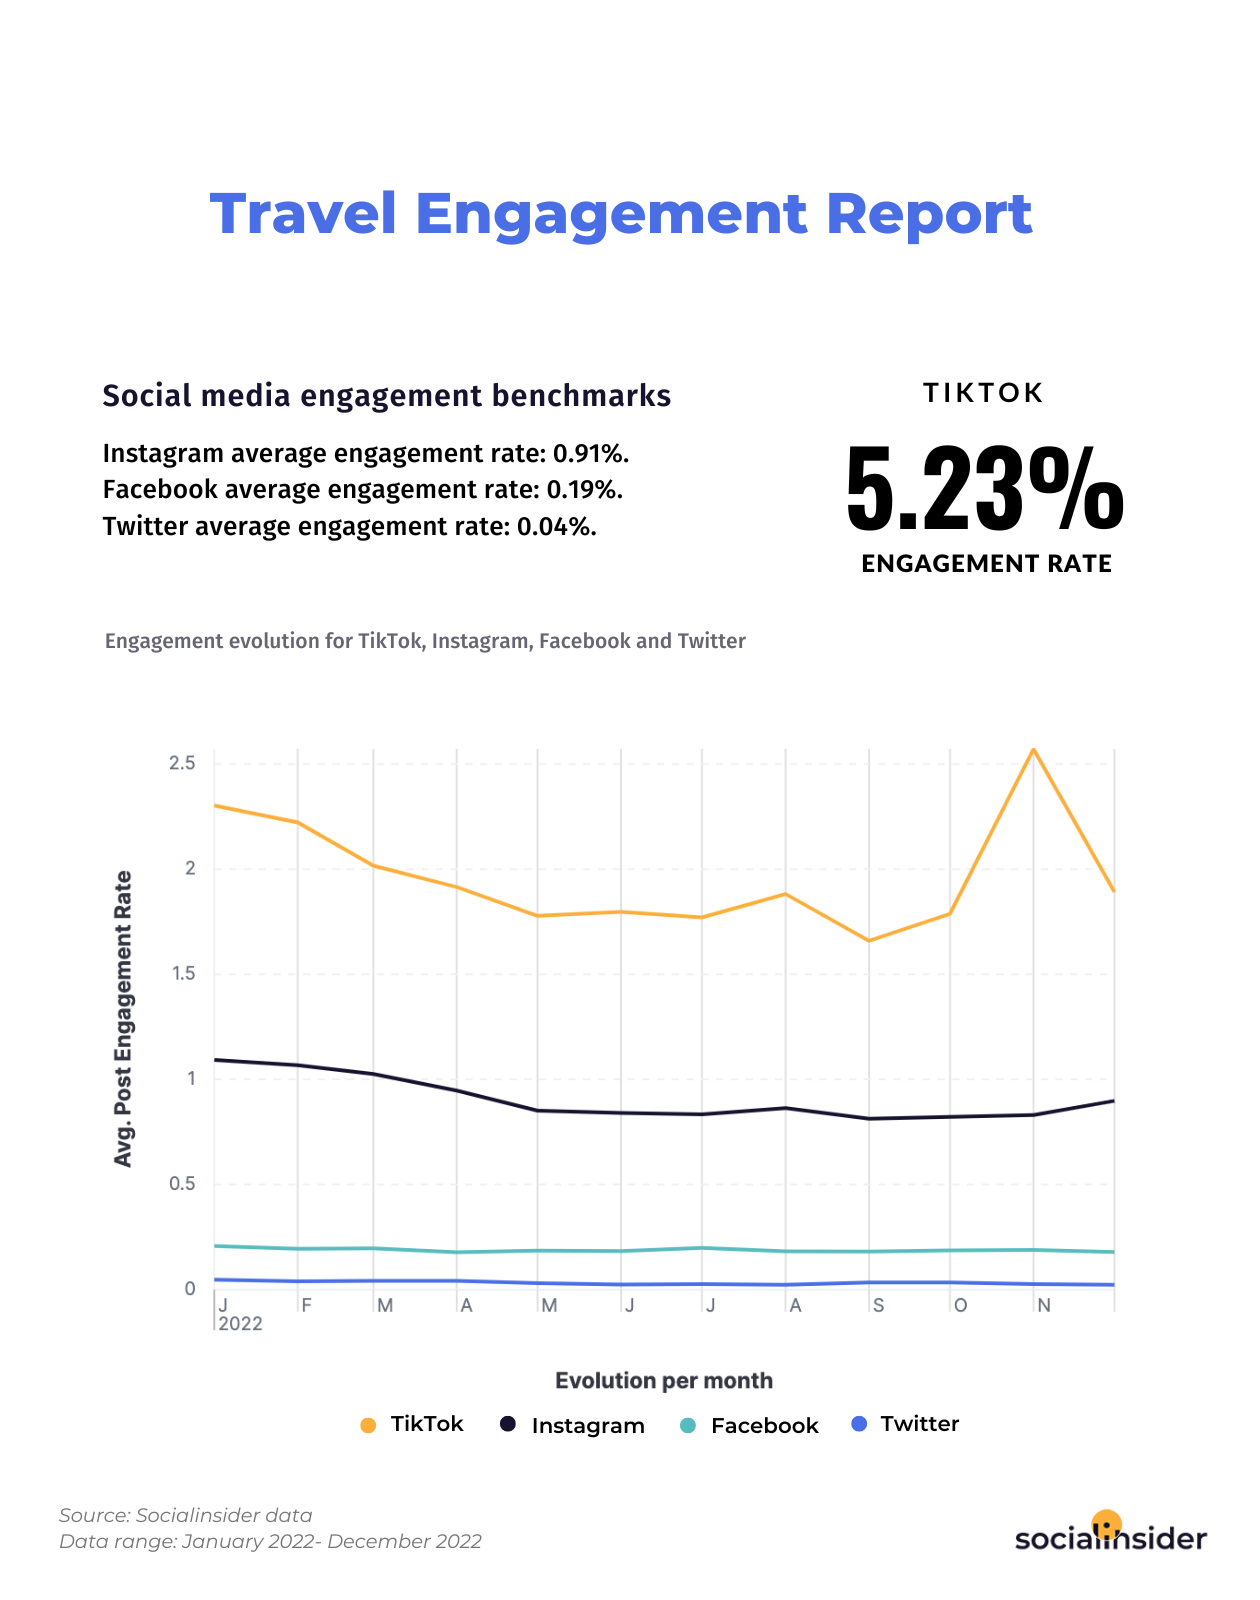
Travel: social media engagement
Having a TikTok average engagement rate of 5.23%, the travel industry got pretty hit in its average engagement rates over 2022, as there was a major dropping tendency that went on until the last quarter of the year.
Switching over to Instagram, here businesses from the travel sector recorded an average engagement rate of 0.91%.
Moreover, looking at the rest of the engagement rates across the board, the industry has reached an average Facebook engagement rate of 0.19%, while the Twitter engagement rate pointed to an average of 0.04%.
D. Social media benchmarks and best practices according to experts
Below you’ll find a couple of best practices for effective social media marketing on all the platforms included in the previous analysis.
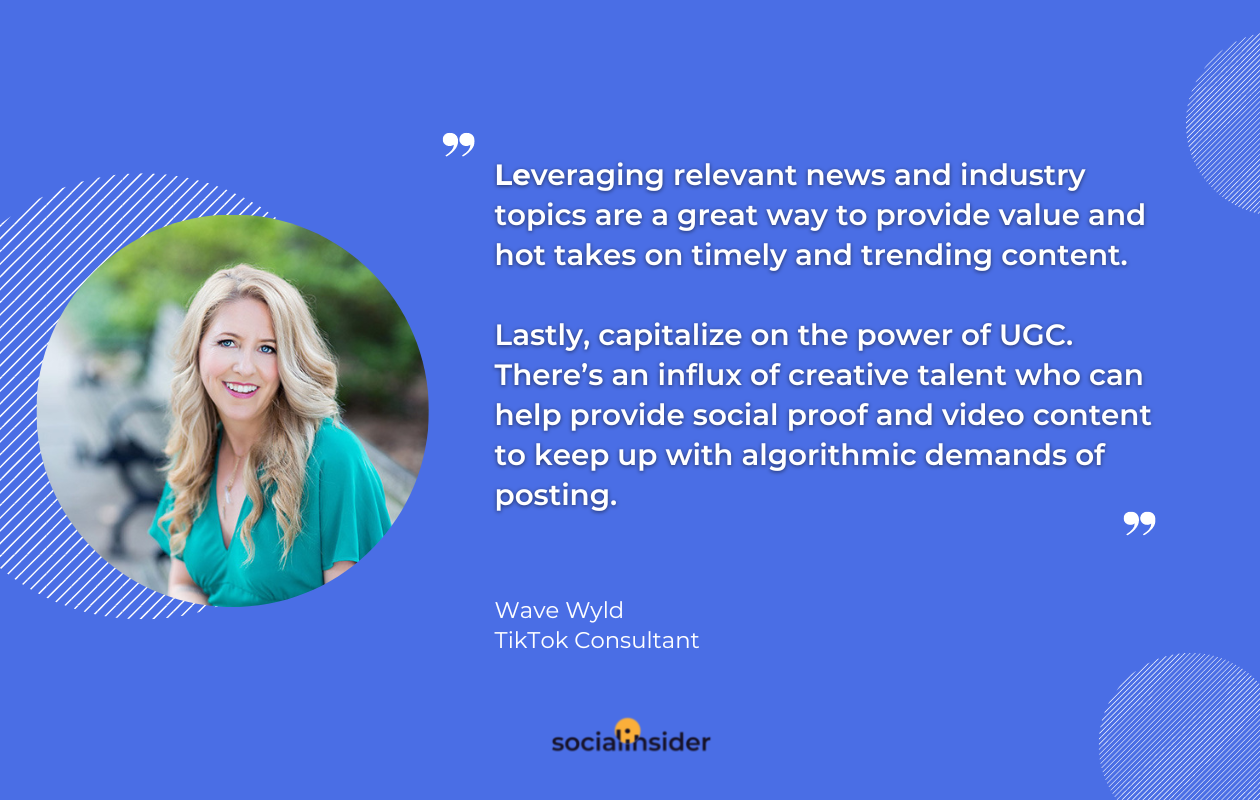
For TikTok, Wave Wyld – a TikTok consultant, has a couple of recommendations, applying especially to B2B brands:
- ” First, you must make content that is unique to the platform. Audiences are more likely to watch and engage with video content that fits in with TikTok culture and trends. Repurposing content from other platforms is less likely to perform or reach your target audience when it is not adapted to the platform.
- Next, leveraging relevant news and industry topics is a great way to provide value and hot takes on timely and trending content.
- Lastly, leverage the power of UGC. There’s an influx of creative talent who can help provide social proof and video content to keep up with the algorithmic demands of posting. “
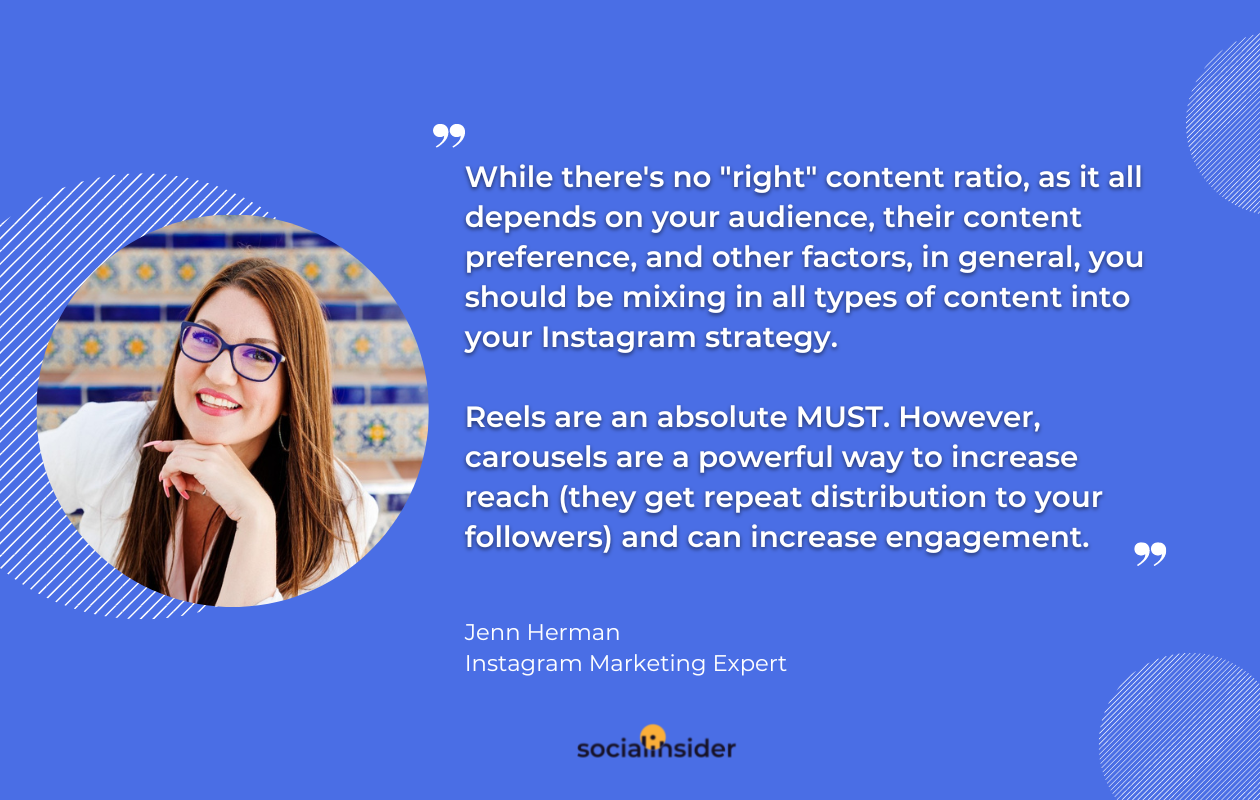
When it comes to Instagram marketing, Jenn Herman – Instagram expert, shared with us the following performance secrets:
” While there’s no “right” content ratio, as it all depends on your audience, their content preference, and other factors. In general, you should mix all types of content into your Instagram strategy. Reels are an absolute must, while carousels are a powerful way to increase reach (because they get repeat distribution to your followers) and can increase engagement.
All in all, feed posts are still the backbone of Instagram and can’t be forgotten.
I recommend incorporating all three types of content regularly. If you’re posting 3 times a week, aim for one of each type. If you’re posting 4-5 times a week, then mix up weekly whether you do 1 or 2 Reels, etc.
As for Stories, more is more! If you can have a fresh post in your Stories (even a single post) every day, it can be significant in your audience participation and retention.
And don’t forget to check your insights on IG! If your insights indicate Reels outperform feed posts, then lean in more to Reels – but don’t go all in on any one type of content. “
As for the godfather of all social media networks, the almighty Facebook, we have brought along some tips from no more and no less than Mari Smith herself.
“Short-form video, high relevancy, and a more personal approach will win the day on Facebook this year.
With Meta continuing to double down on its AI-driven discovery engine, only the best, most relevant content gets served to the right audiences.
If you really want to stand out and increase the chances of having more people discover your business, you’ll need to focus on quality first, not so much quantity.
And, let’s not forget community. Now more than ever is the time to invest in building your loyal community, ideally through a vibrant Facebook Group packed with value! “
And last but not least, for those of you that still invest heavily in Twitter marketing, we have saved a piece of the pie for you and asked Madalyn Sklar – a Twitter expert, for a couple of recommendations.
“If you haven’t already, I think Twitter Spaces is essential to try in 2023.
Spaces provide a different way for you to connect with your audience on the platform, giving you an opportunity to provide valuable tips and tricks through audio content.
By hosting a Spaces show on a regular basis, you can generate brand awareness and establish yourself as an authority in your field. Not only that, but it allows for real-time engagement, making it a great way to network within your community.”
E. Methodology
Within this social media benchmarking report, we provide a representative sample of international brands with an active presence on TikTok, Instagram, Facebook, and Twitter.
The timeframe selected for this research was between January 2022 and December 2022, while also categorizing the profiles into industries based on their activity and page category settings.
We define social media engagement rate as measurable interactions on Facebook, Instagram, Twitter, and TikTok posts, including comments, reactions, and shares, with the particularities for each platform.
Facebook engagement rate per post (by followers): Facebook engagement rate per post is calculated as the sum of reactions, comments, and shares on the post divided by the total number of fans that page has. The result is then multiplied by 100.
Instagram engagement rate per post (by followers): Instagram engagement rate per post is calculated as the sum of likes and comments on the post divided by the total number of followers that the profile has. The result is then multiplied by 100.
Twitter engagement rate per post (by followers): Twitter engagement rate per post is calculated as the sum of likes and Retweets received on the Tweet divided by the total number of followers that profile has. The result is then multiplied by 100.
Fonte:SocialInsider